|
The resulting list of objects can be filtered for different object types, domains (market verticals), and volume levels.
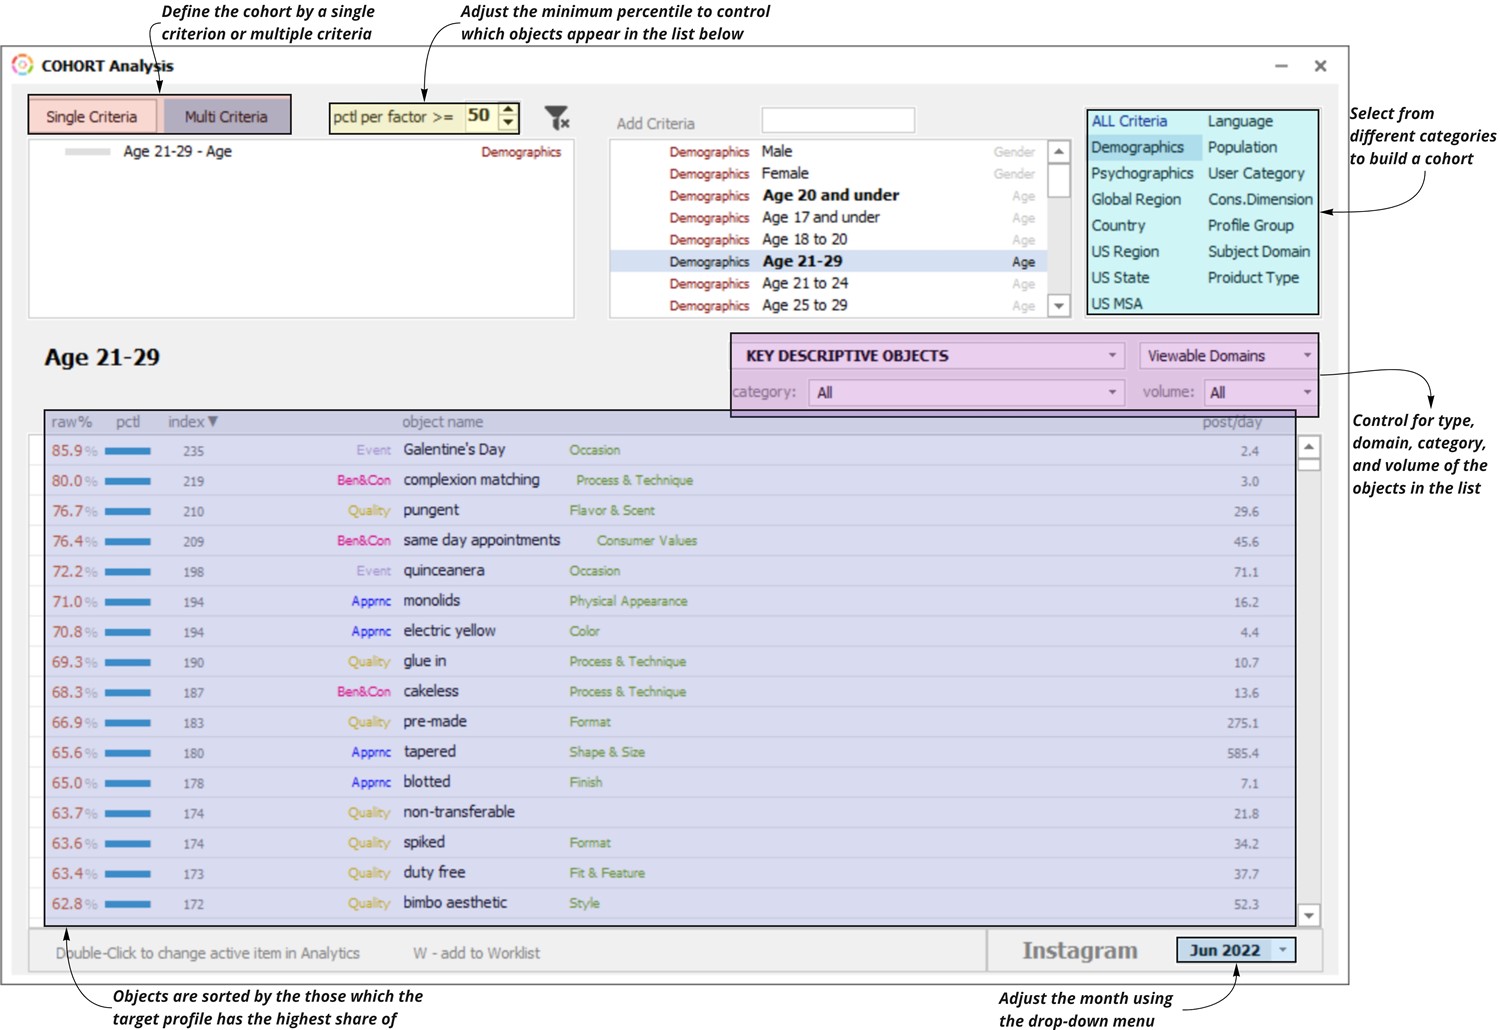
The list will be sorted by the percent of object conversations coming from the chosen target profile. For example, 85.9% of Galentine’s Day conversations come from individuals ages 21-29. Use the drop-down at the bottom right of the application window to change the time period.
The minimum percentile per factor controls which objects appear in the list based on the factors that define the cohort. Setting the min percentile per factor at 50 means that each factor (in the case of Multi Criteria) or the factor (in the case of Single Criteria) needs to be in at least the 50th percentile in the object’s conversations for the object to appear in the list. This metric can be adjusted to expand or shrink the range of objects.
The filter is defaulted to show objects (in the Beauty market vertical) that rank above the 50th percentile for the amount of conversation generated by individuals ages 21-29 relative to similarly categorized objects.
This means the percent of people talking about a specific object that are 21-29 is above the median rate for similarly categorized objects in the market vertical.
Right-click on the table to export the list and data to Excel. |