| When assessing a focus object, it is helpful to understand which comparison objects are changing most in their penetration of the focus object over time.
Which competitors are showing up in a higher % of Olay conversations from May 2021 to May 2022? How are the topics mentioned frequently alongside the focus object changing over time?
To observe these changes and trends:
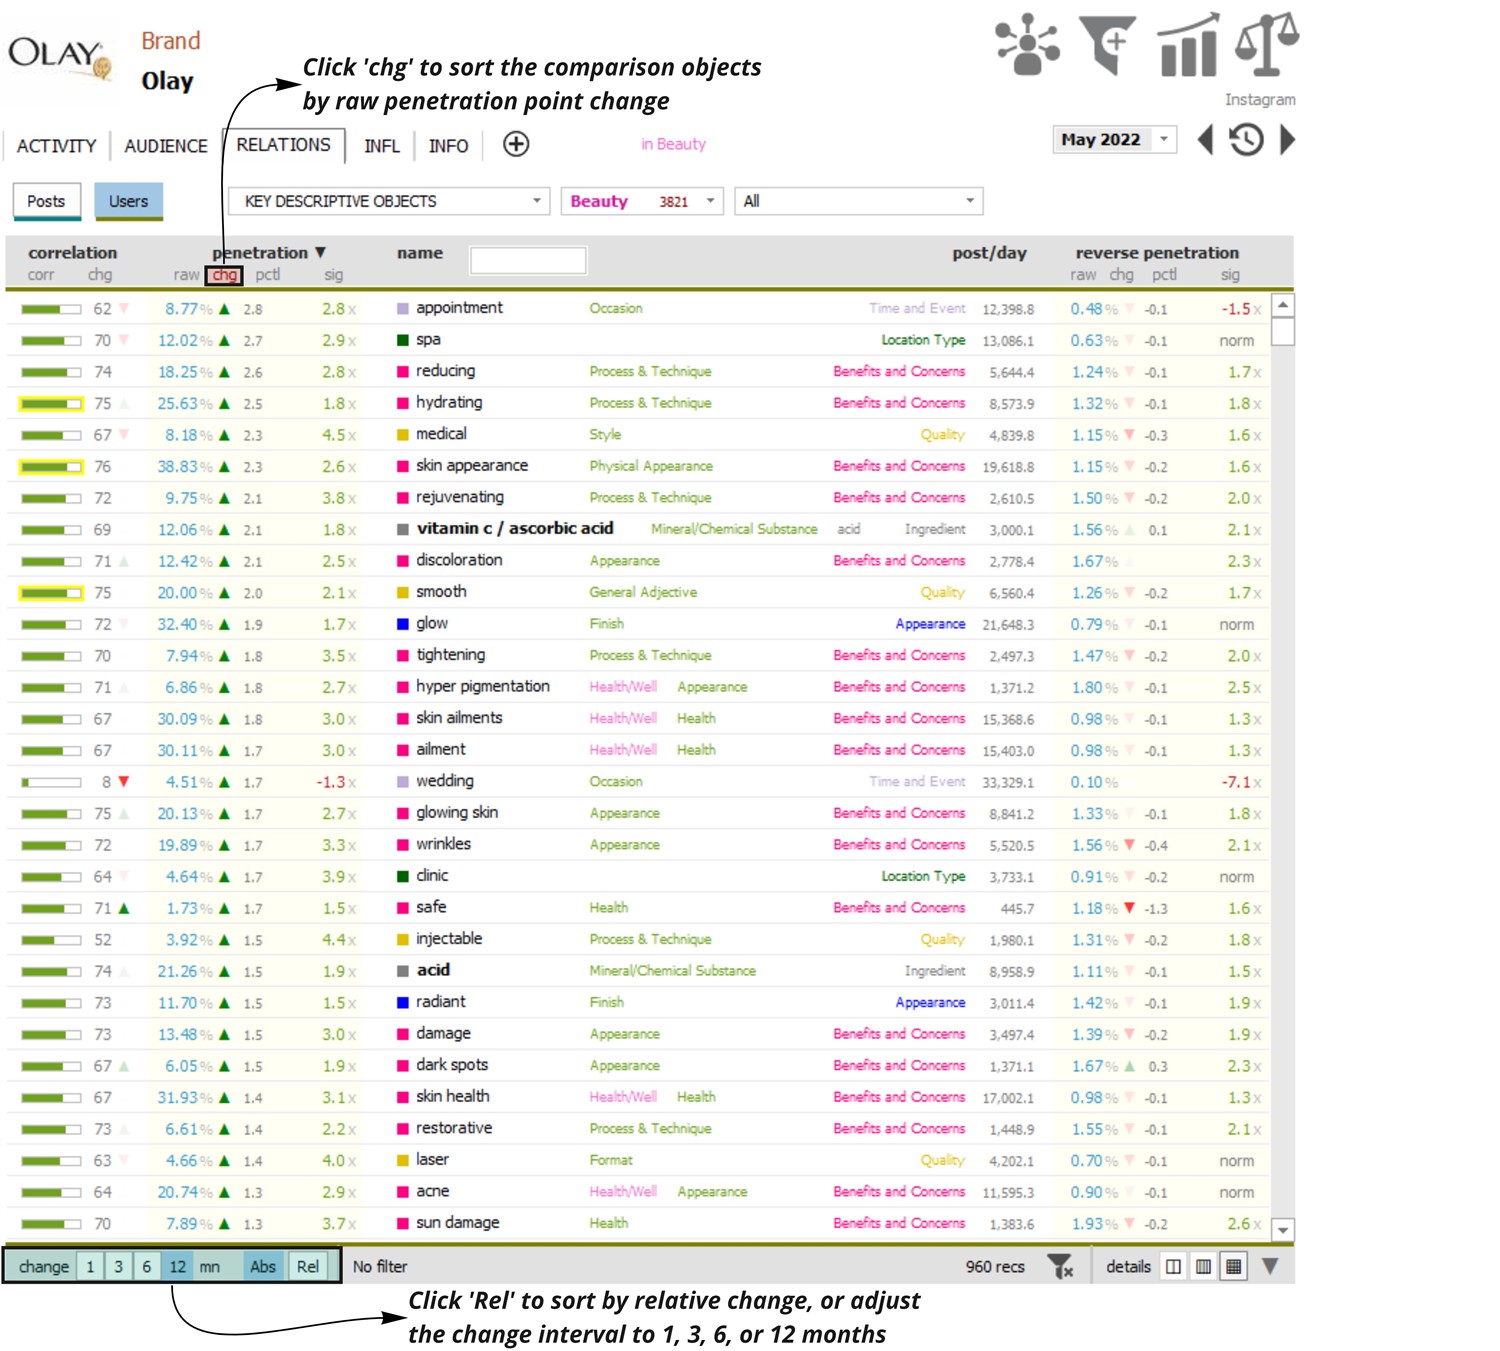
Under the Penetration column, select ‘chg’ to sort the objects by penetration point change. At the bottom of the screen, adjust the change interval to 1 month, 3 months, 6 months, or 12 months (image 1).
|
|
To adjust how the output is displayed, toggle between absolute and relative change at the bottom of the screen next to the change time period selection. Abs will show the actual percentage point change, while Rel will show the relative change as a percent of the original.
For example, an absolute change of 2.8 over 12 months for the object ‘appointment’ means its raw penetration increased by 2.8 points over the past year (i.e. in May 2021, ‘appointment’ was mentioned in 8.77% - 2.8 = 5.97% of Olay conversations). Expressed as a relative change, this would mean that the object’s share of Olay conversations is up roughly 47% ([8.77 - 5.97] / 5.97).
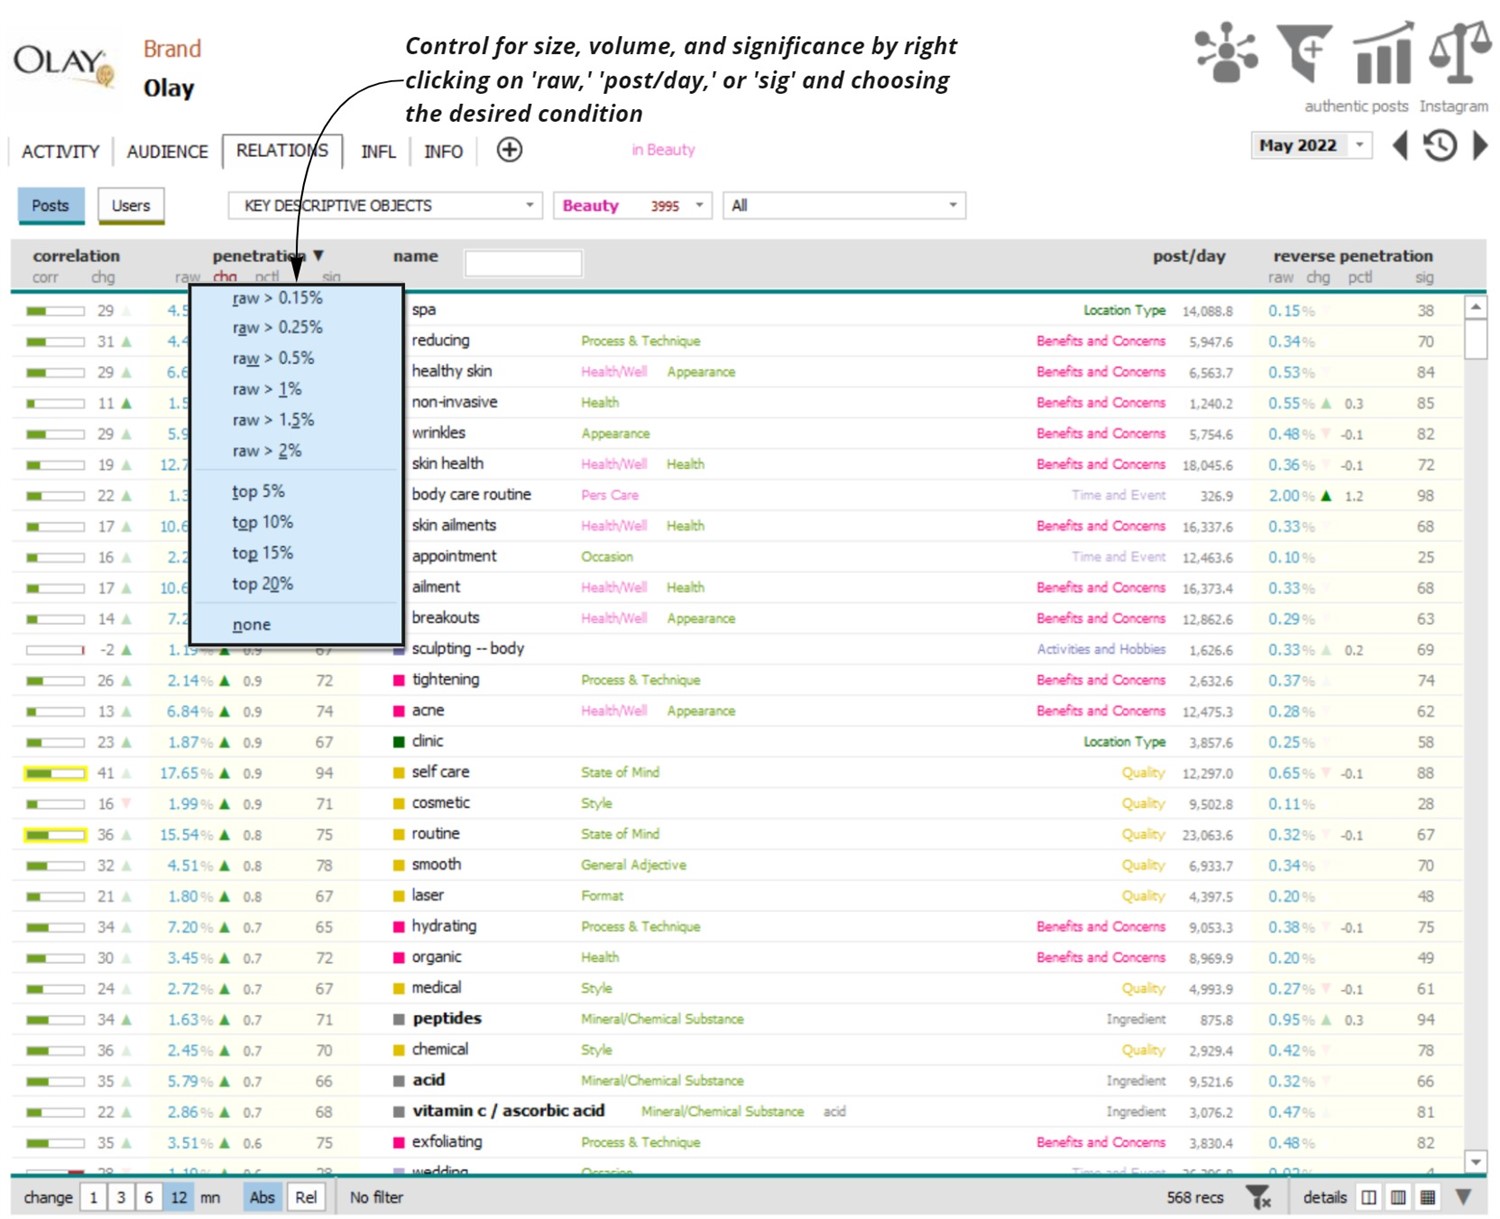
By default, comparison objects are only listed if they co-occur with the focus object. This means that they have been mentioned alongside the focus object enough times to generate co-occurrence data in the Social Standards platform. Some comparison objects are mentioned more frequently alongside the focus object, or more frequently overall. Control for size, volume, and significance of the comparison objects loaded by right-clicking on ‘raw,’ ‘post/day,’ or ‘sig’ respectively (image 2).
|
|
To analyze how a comparison object's penetration of the focus object is changing, single-click on the comparison object and press 'T'. A separate window will appear with a trended view of the comparison object's presence in the focus object’s conversations. From here, choose to view change for several metrics: correlation, penetration, reverse penetration, or co-positivity. Trends can be observed on both a raw and percentile basis (image 3). |