|
| |
| |
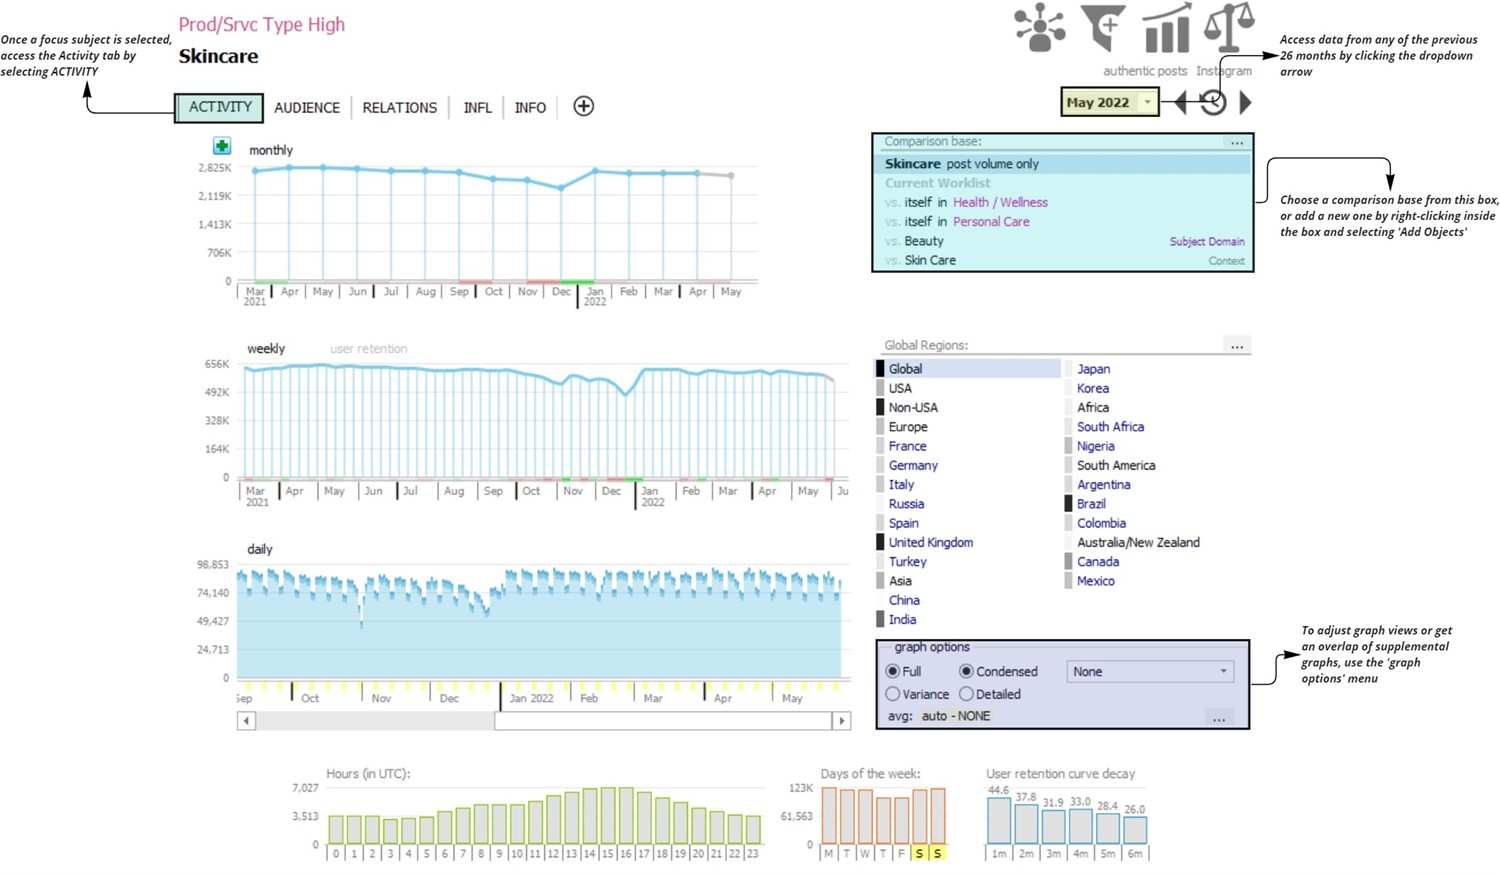
| The Activity Tab (image 1) displays conversation performance and activity for the focus subject.
|
|
 |
|
|
Conversation volume is displayed as a blue line, and is organized by monthly, weekly, and daily time periods.
Performance of the focus subject can be compared with a related object on the same graph. Use the comparison base options on the right-hand side to select a related object. You can add any object for comparison in the database by right clicking inside the comparison base box.
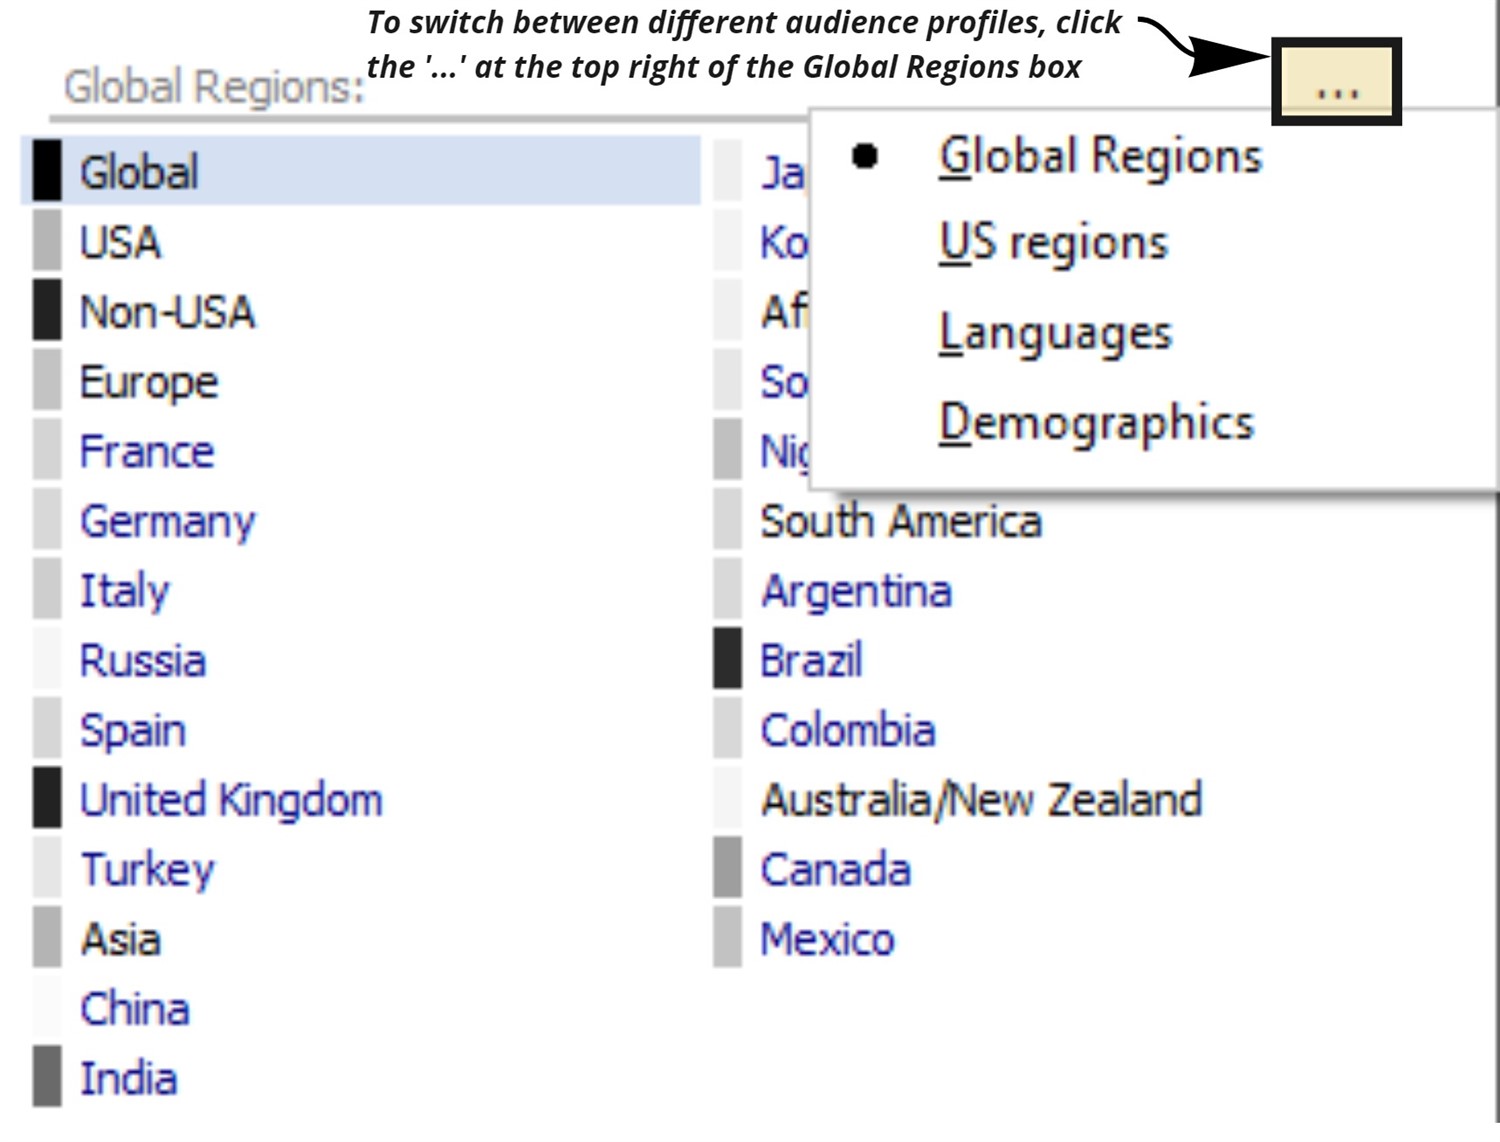
Conversation volume can be segmented by different audience profiles, including global and US regions, language, and demographics by selecting an option in the Global Regions box on the right hand side. To switch to a different audience profile, click the ‘...’ button located at the top right of the Global Regions box (image 2).
|
|
 |
|
|
Supplemental graphs available in this tab include positive sentiment, spam, like percentile, comment percentile, user retention, new user %, and more. These can be selected in the dropdown under ‘graph options’ on the lower right-hand side of the screen.
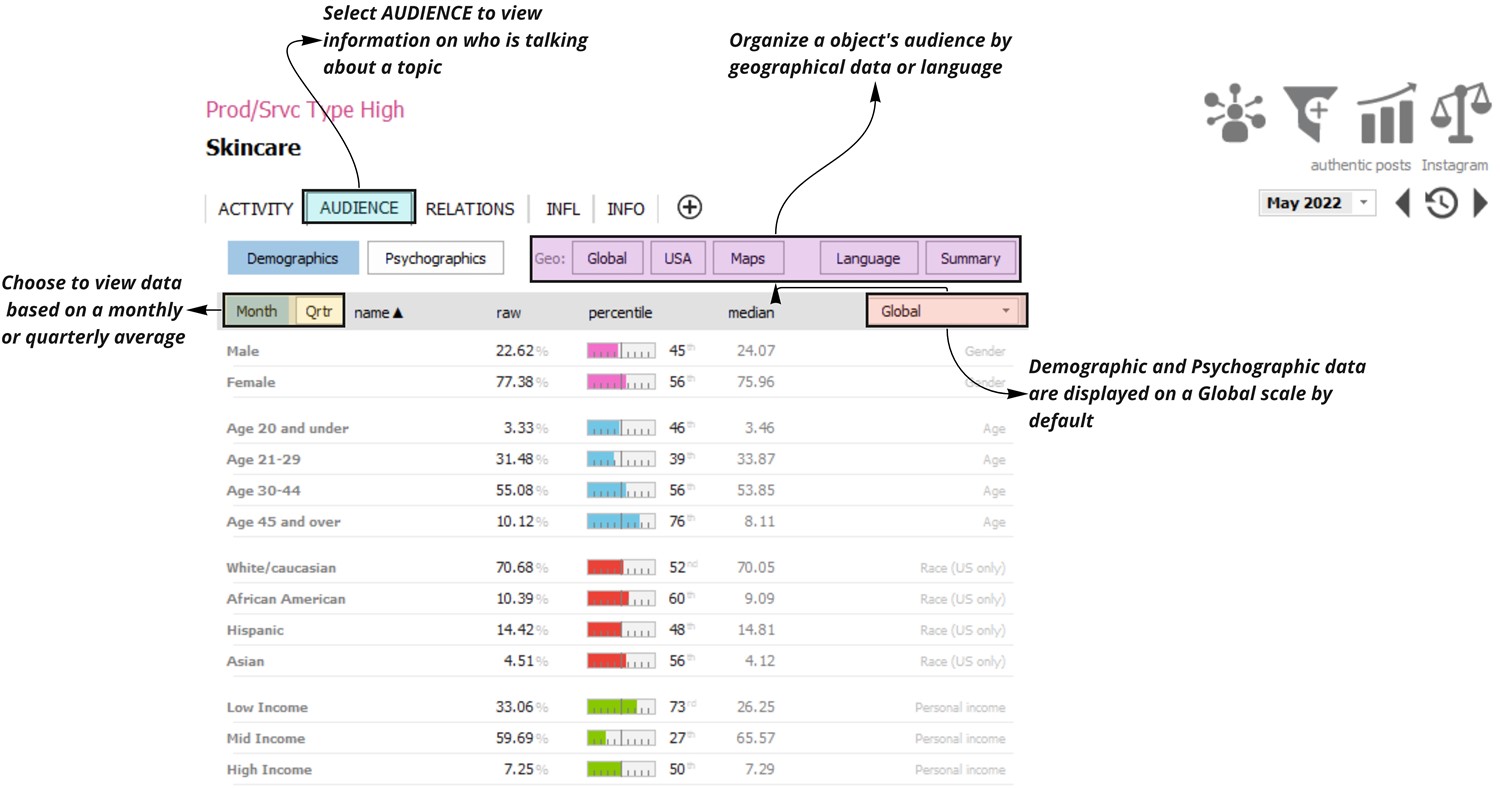
The Audience Tab (image 3) provides information on who talked about the object in terms of their demographic and psychographic profile, where they were located when they spoke about the object, and what language they used in their posts.
|
|
 |
|
|
Demographic and Psychographic data are provided on a quarterly Global scale by default. These can be adjusted by clicking on the appropriate button in the gray bar. As in the Activity Tab, the month can be adjusted by clicking the dropdown located on the top right of the application window.
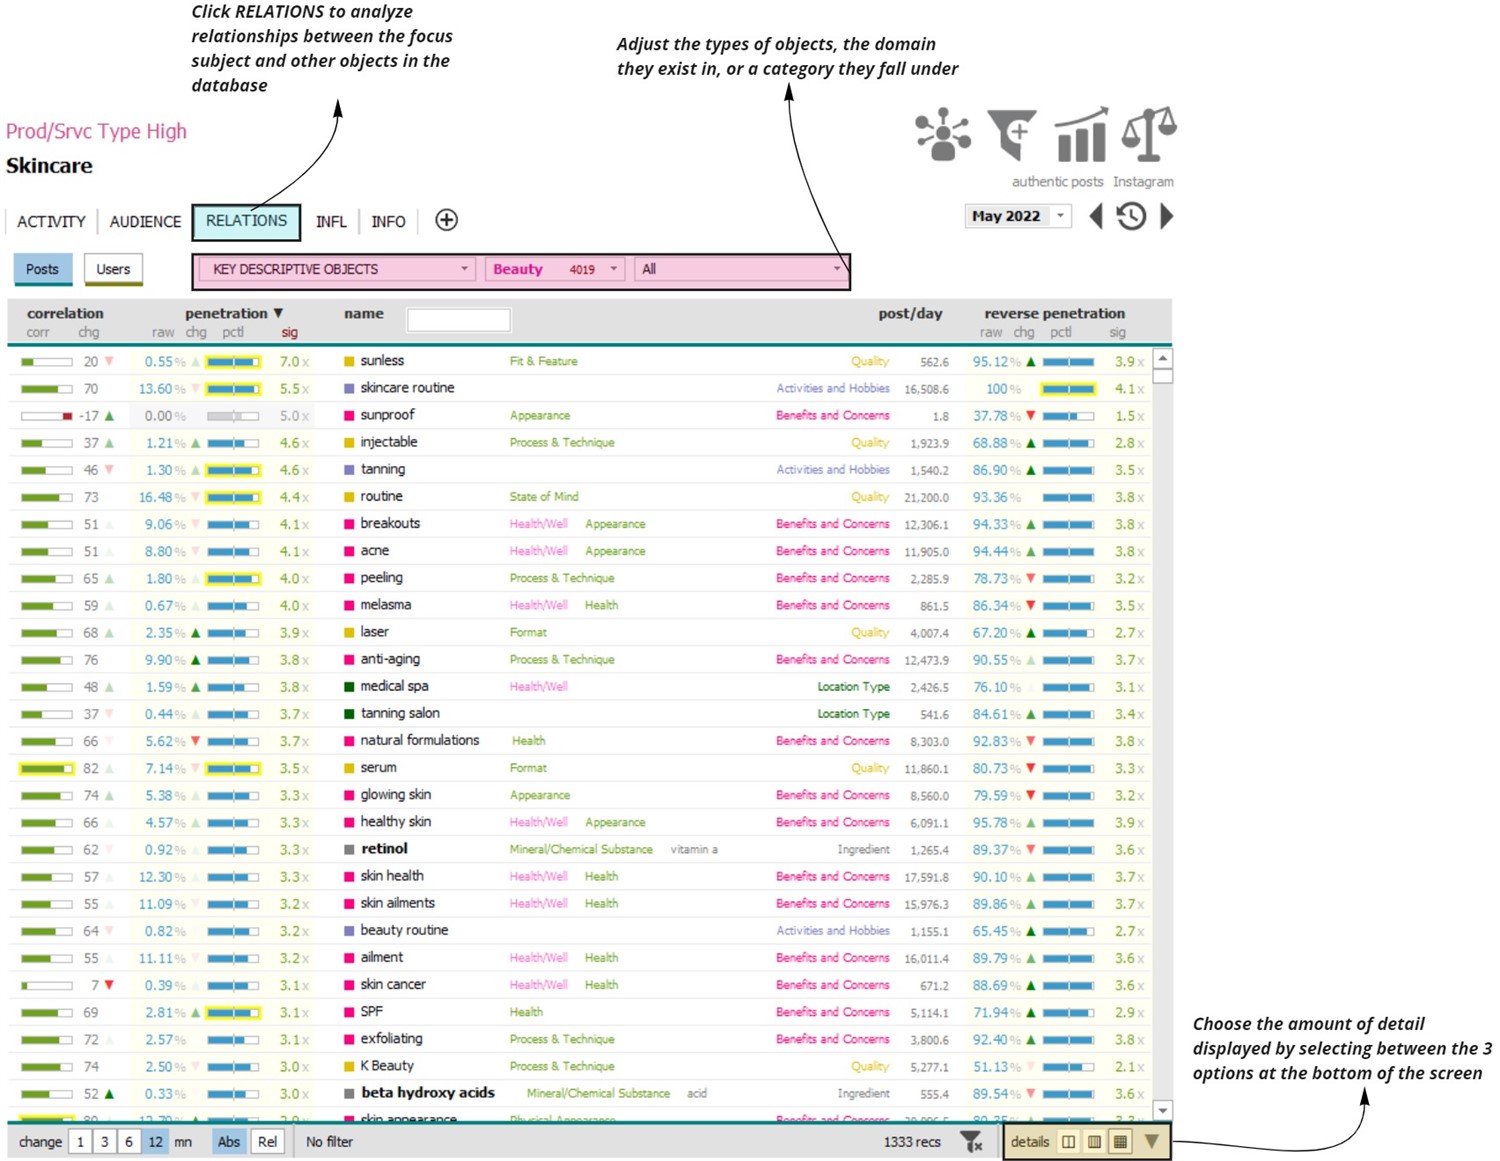
The Relations Tab (image 4) shows relationships between the focus subject and other objects in the database. Click the KEY DESCRIPTIVE OBJECTS dropdown menu to choose between other object types that are mentioned alongside the focus subject.
|
|
 |
|
|
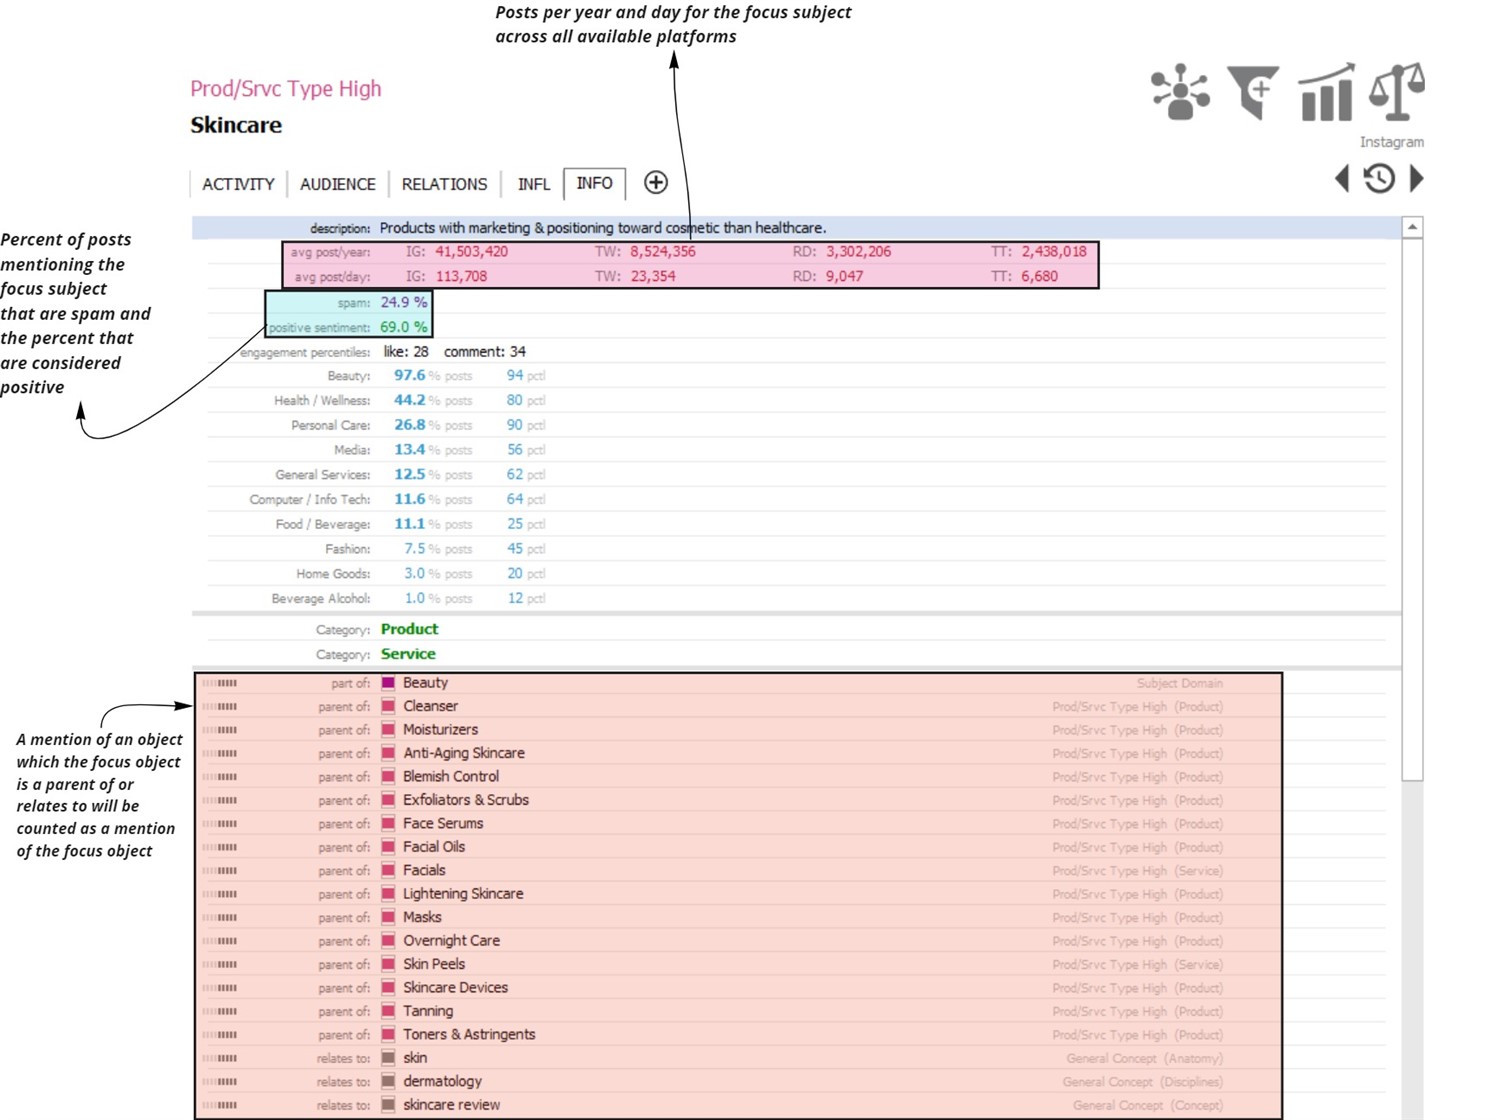
The Info Tab (image 5) defines the focus object as it appears in the Social Standards platform, lists other objects it is related to, provides details of the object’s presence across all platforms and domains, and more. Mentions of objects which the focus object is related to or is a parent of will also be considered a mention of the focus object. In the case of the image below, since ‘skincare’ is a parent of ‘cleanser,’ a mention of ‘cleanser’ will also be counted as a mention of ‘skincare’ in the Social Standards database.
|
|
 |
|
|
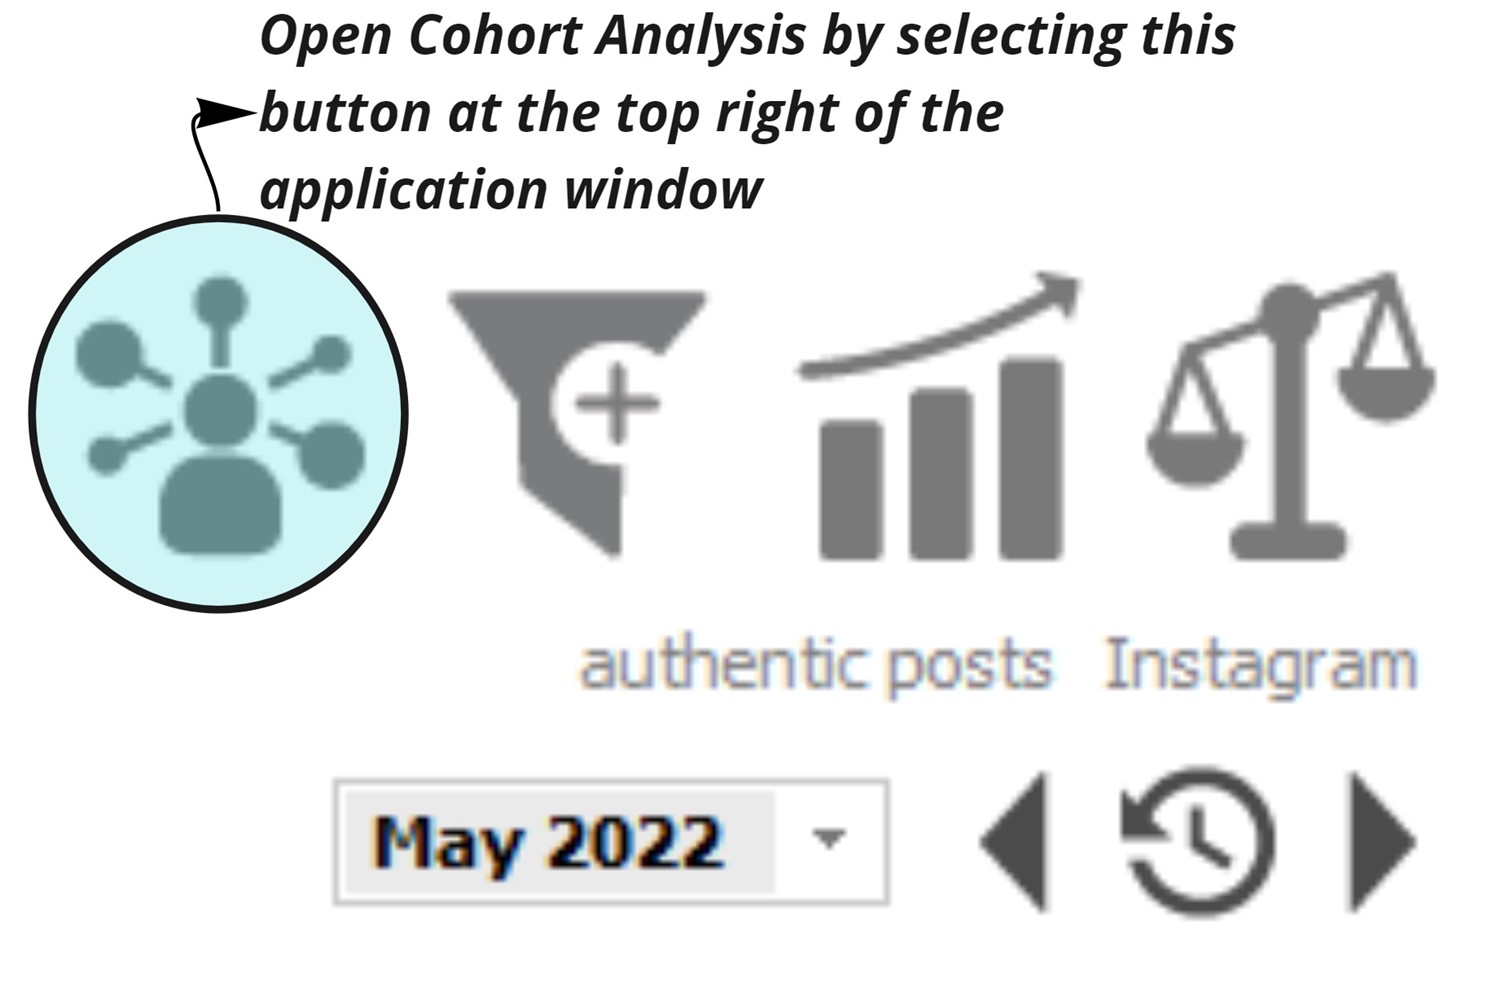
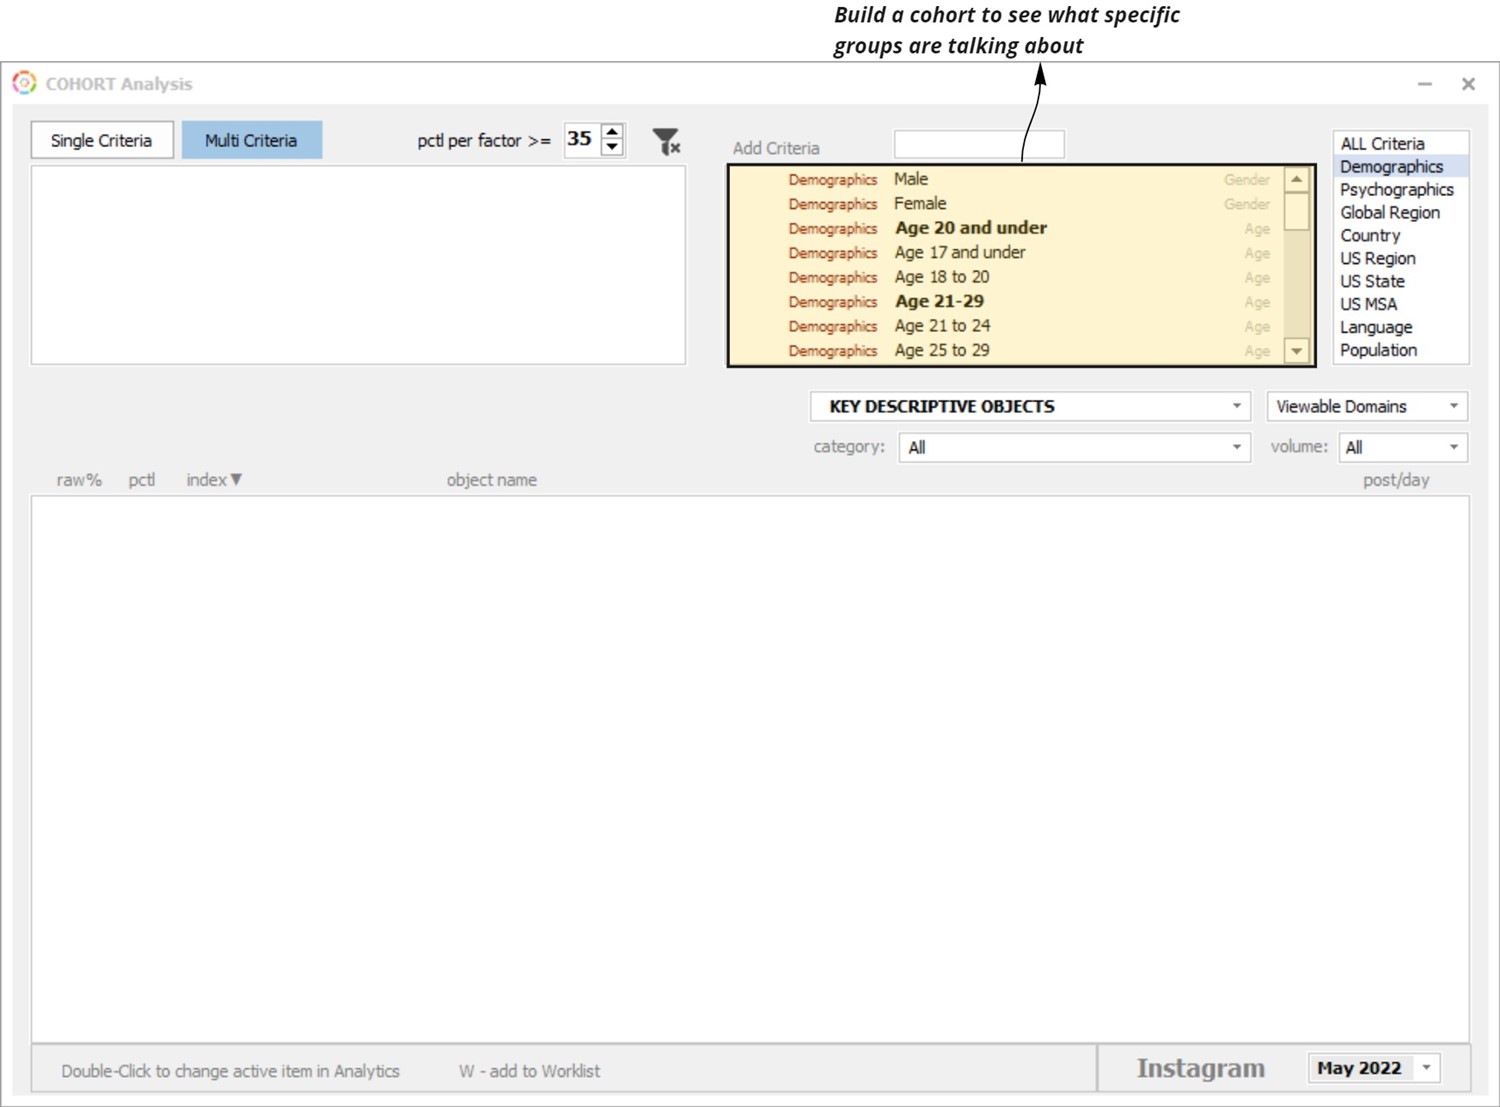
Cohort Analysis (image 6) helps to answer which objects are most uniquely skewed toward a specific demographic or psychographic trait or geography (image 7).
|
|
 |
|
|
 |
|
|
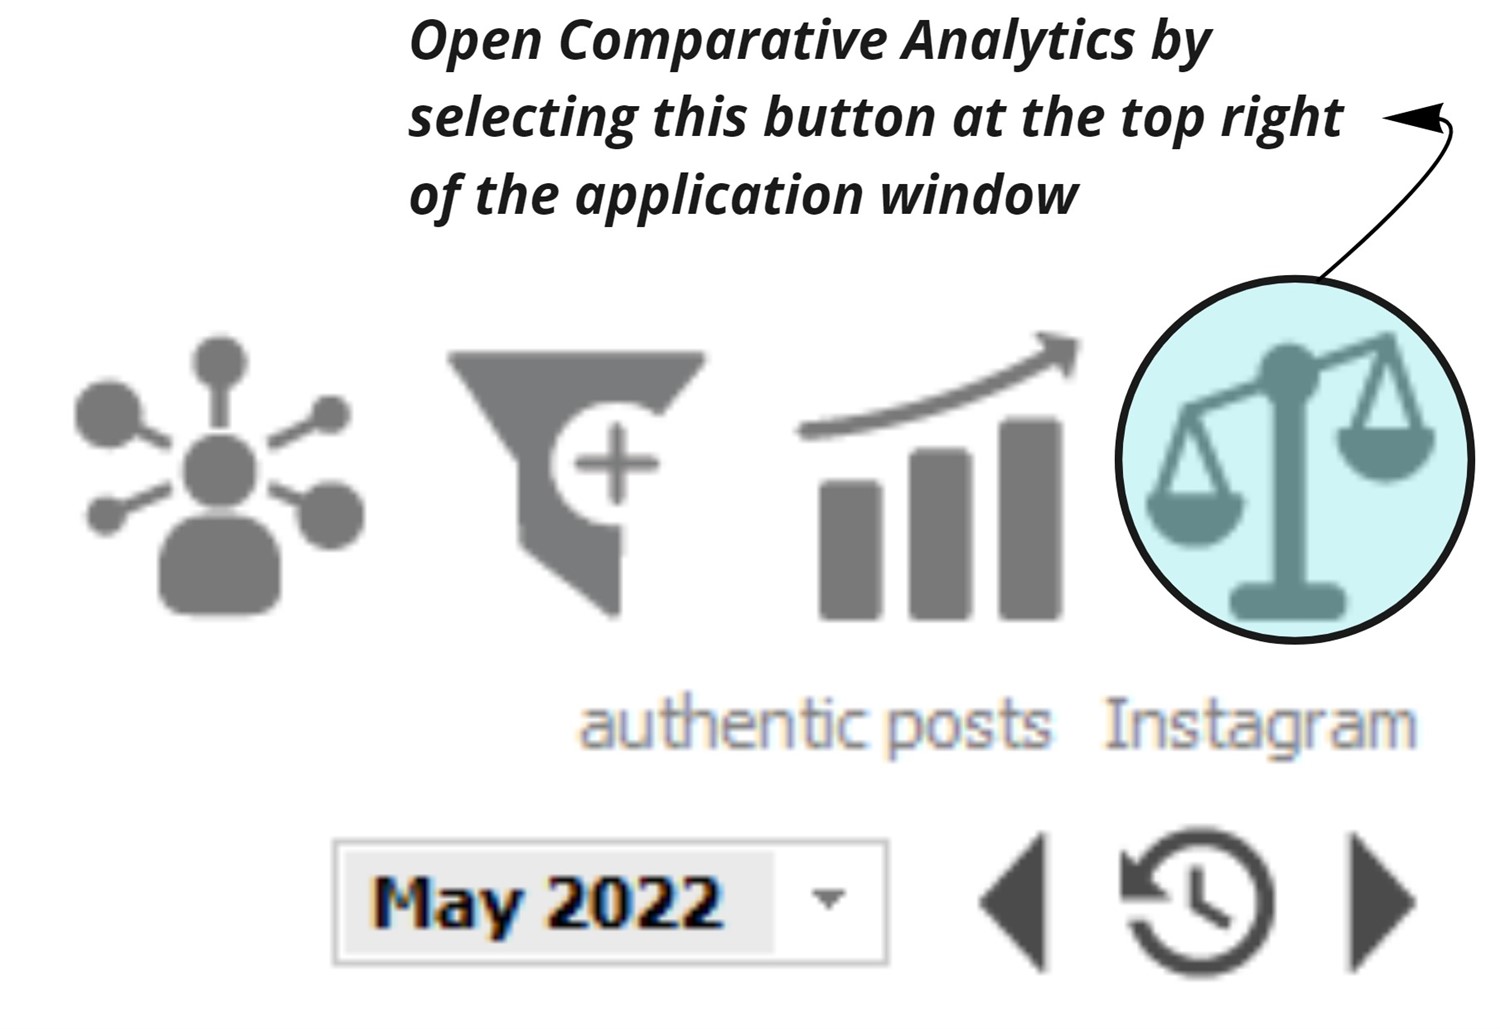
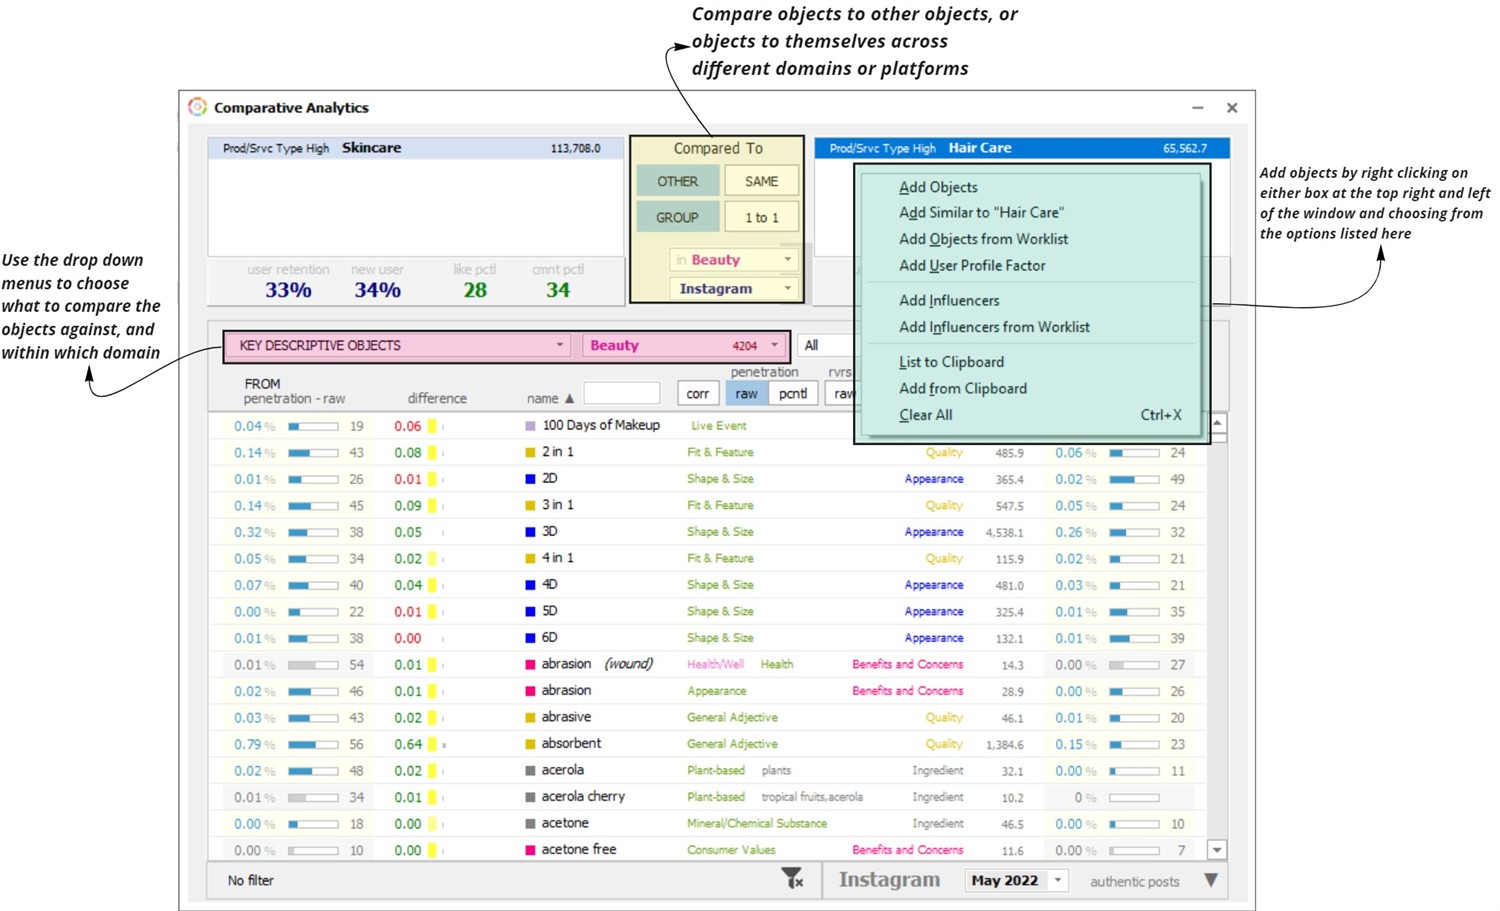
Use Comparative Analytics to compare an object, or set of objects, to another object or set. Or, compare an object to itself among two different domains or platforms.
To open, click on the scales icon found in the top right corner of the application window (image 8).
|
|
 |
|
|
Add objects on the left and right hand sides by right clicking on the boxes and selecting ‘Add Objects,’ or delete them by single clicking on the object and pressing the ‘Delete’ button on the keyboard. Once objects are loaded, select which types of objects to compare them against and within which domain (image 9).
|
|
 |
|
|
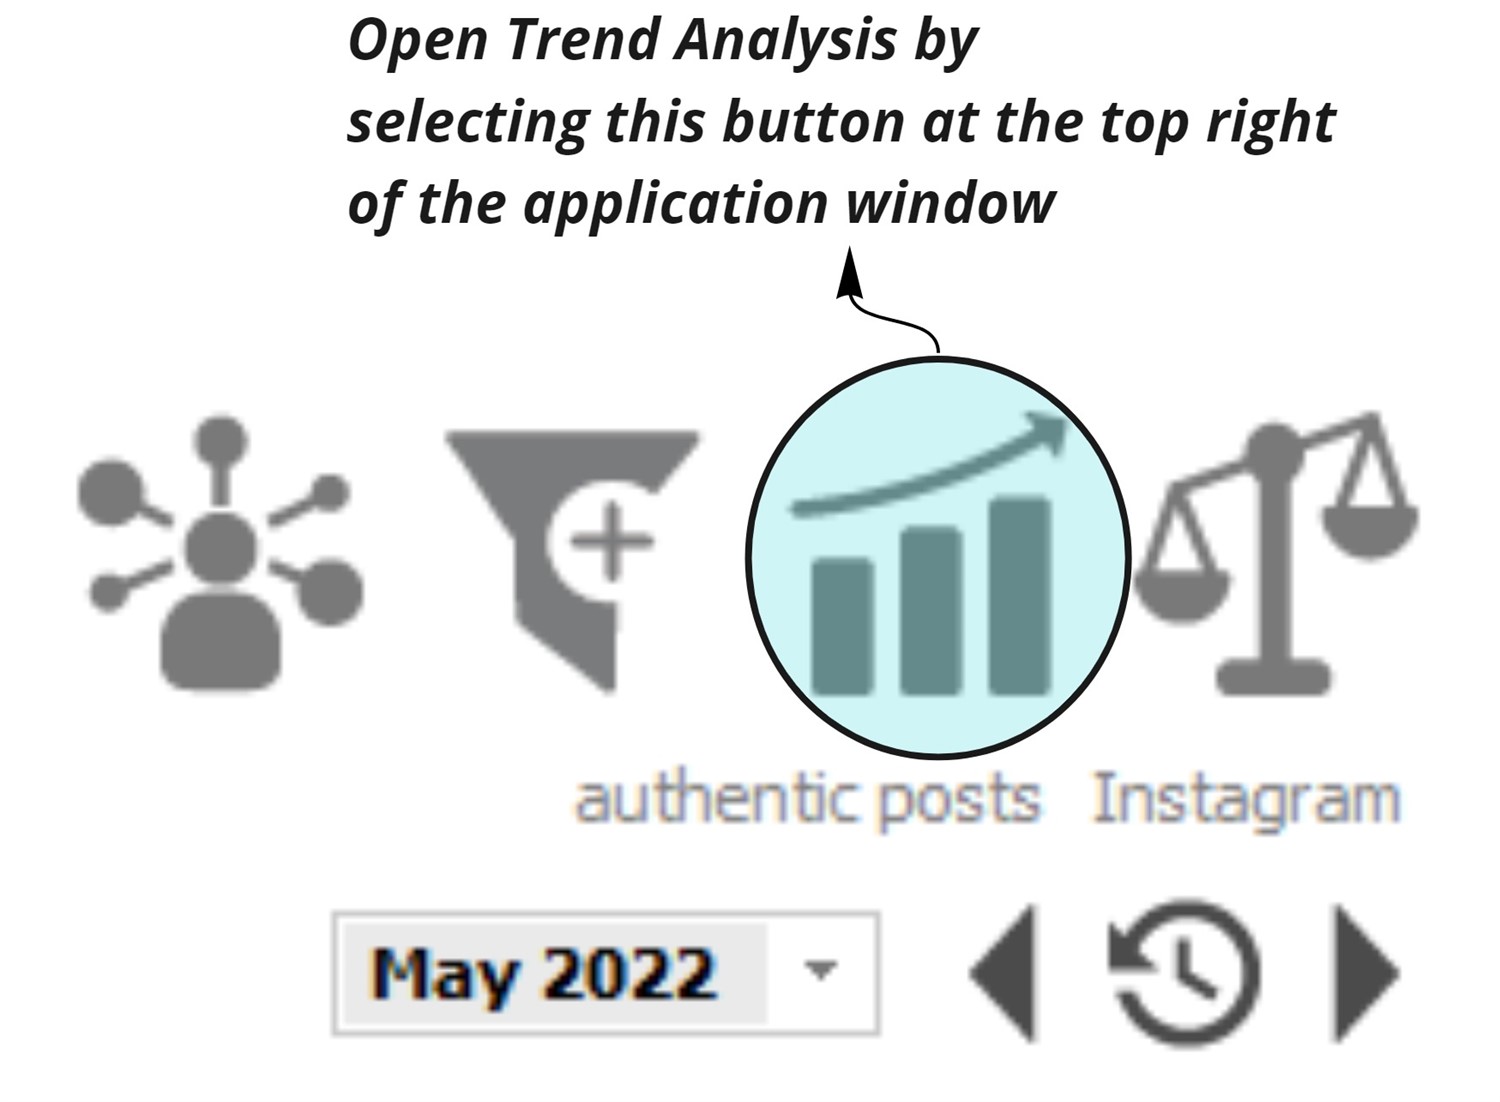
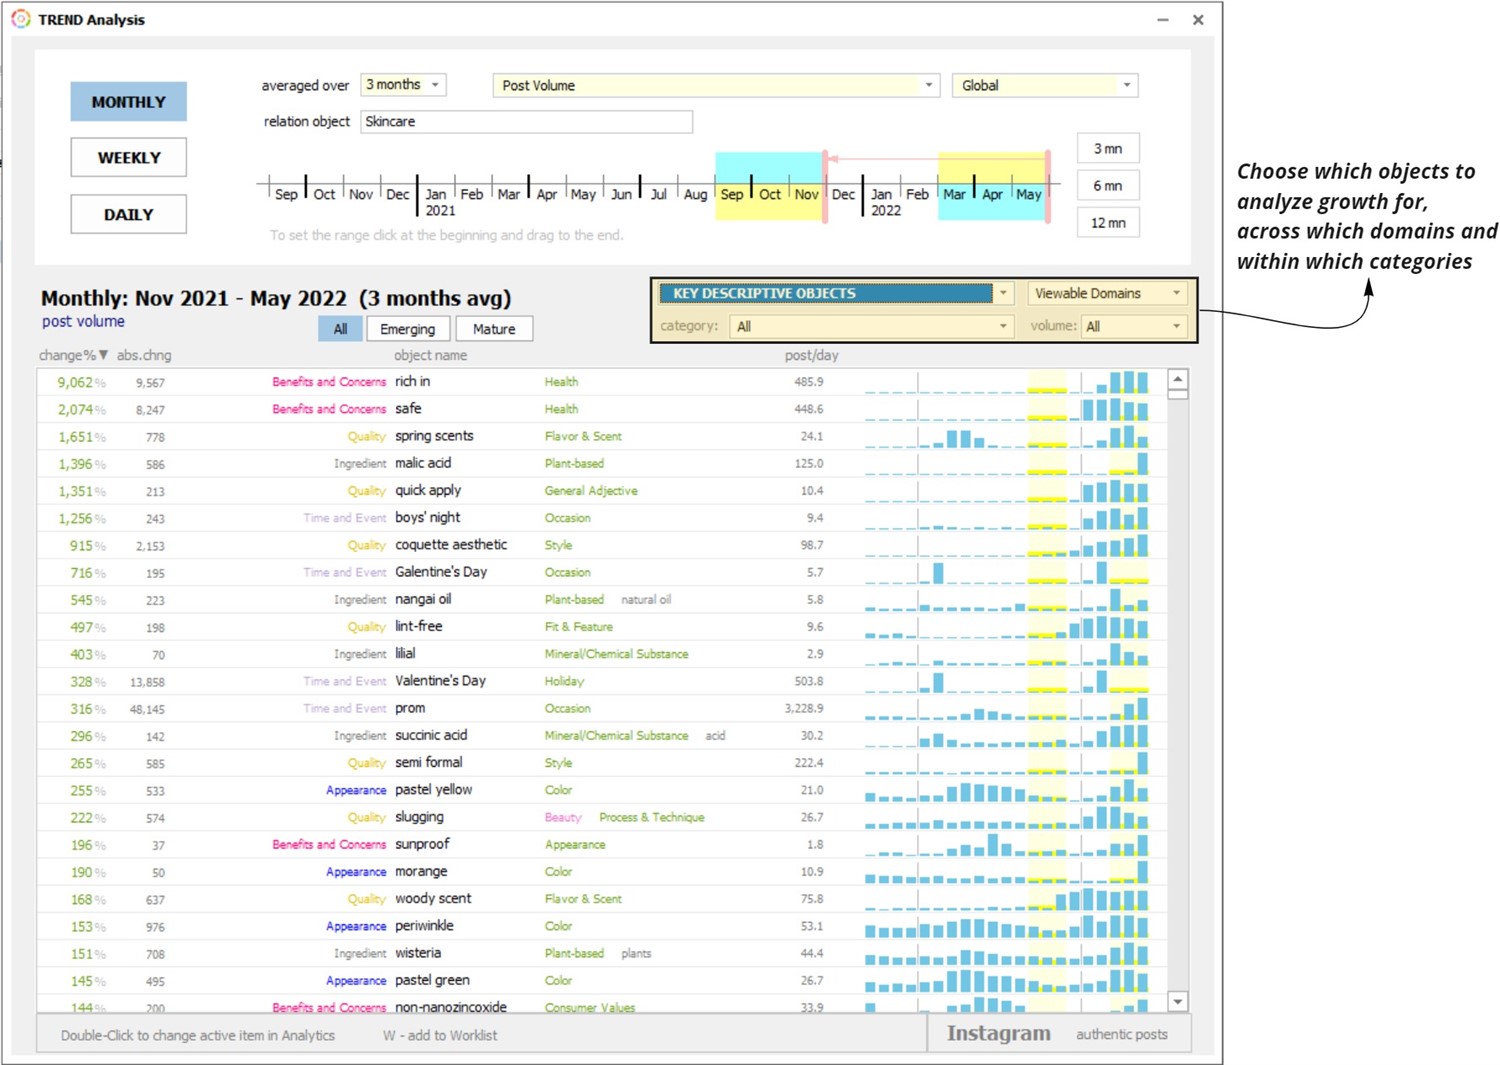
Trend Analysis (image 10) helps identify areas of growth or decline in the market for a specific time period (image 11).
|
|
 |
|
|
 |
|
|
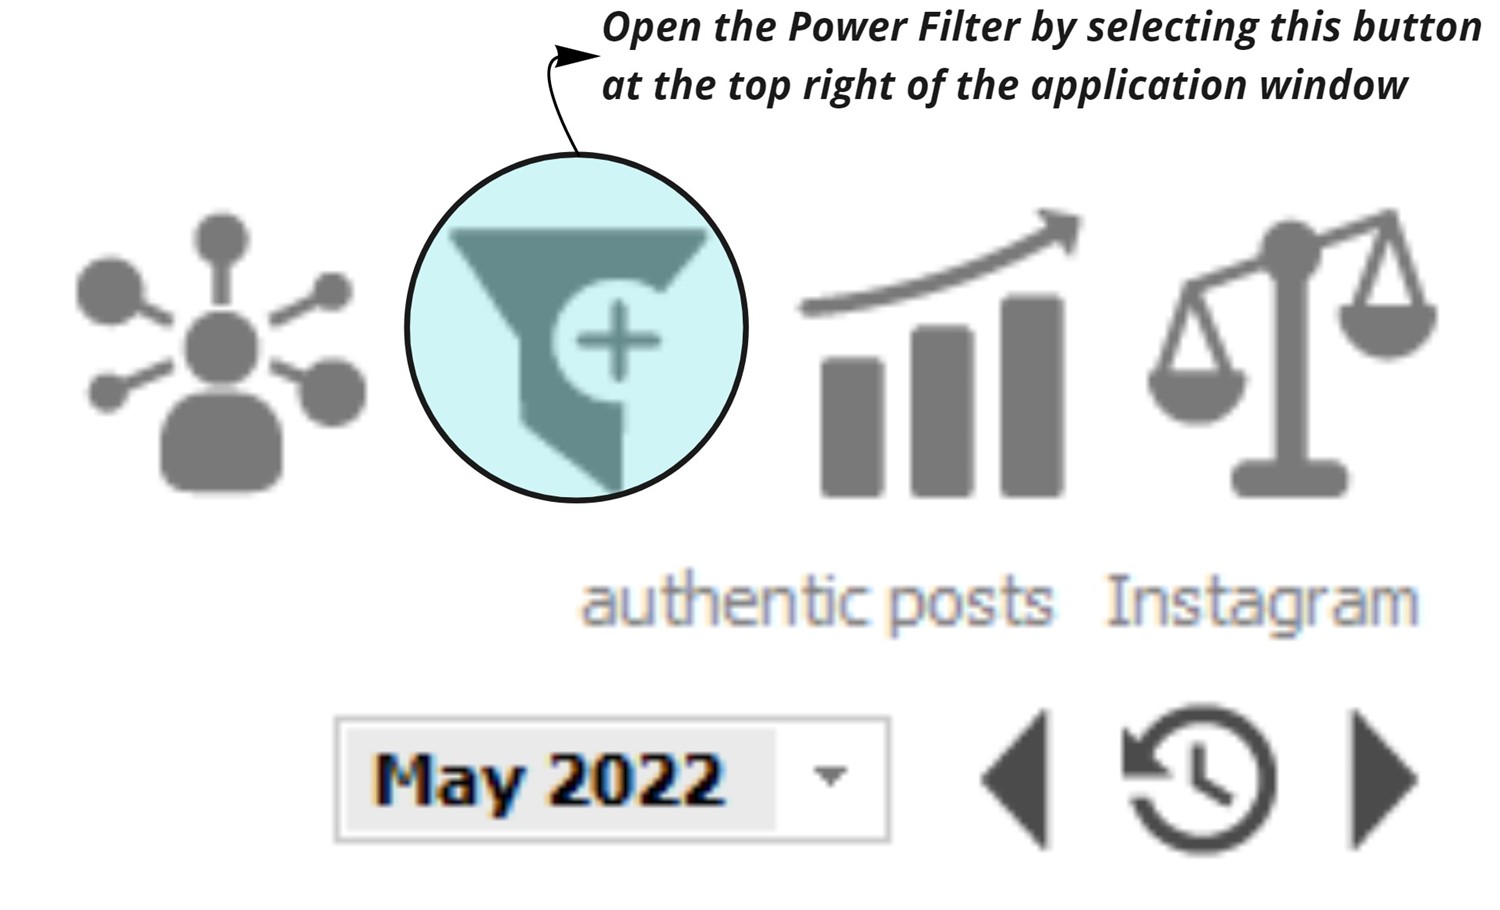
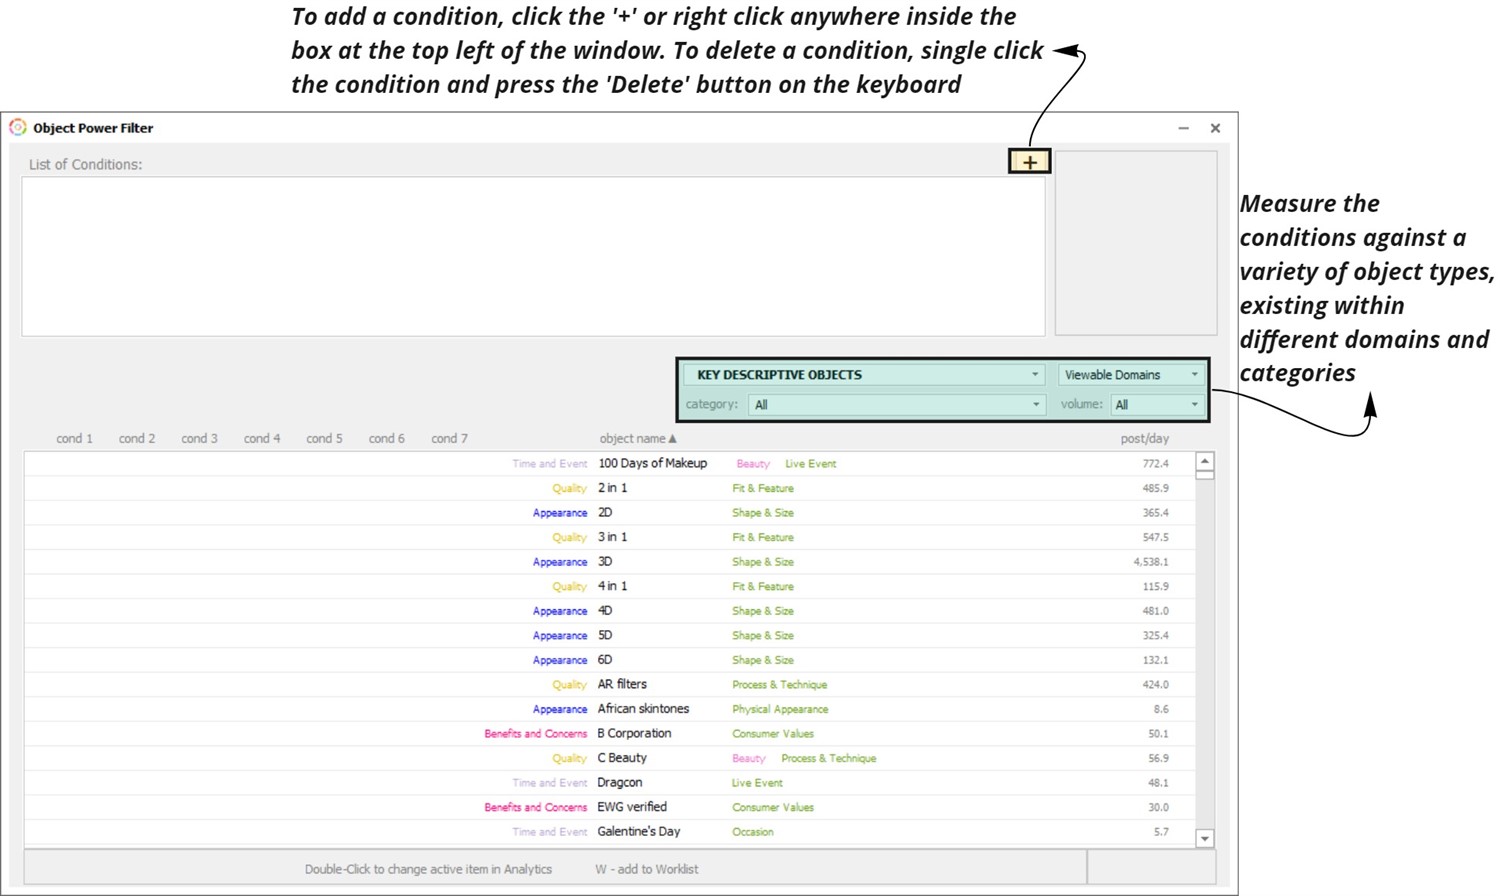
The Power Filter (image 12) simultaneously measures up to 7 different conditions against a set of objects to get a holistic sense of performance in a specific area (image 13).
|
|
 |
|
|
 |
|
|
Use cases of the Power Filter include (but are not limited to):
◆ What is growing in 21-29 year old male conversations in the Beauty vertical YoY?
◆ Which brands in Food/Beverage have a declining user retention % but a growing new user % over the past 6 months?
◆ On which social media platform are selected object types growing/declining the fastest? |
