| The Psychographics section contains information on the affinities and interests of those talking about the focus object.
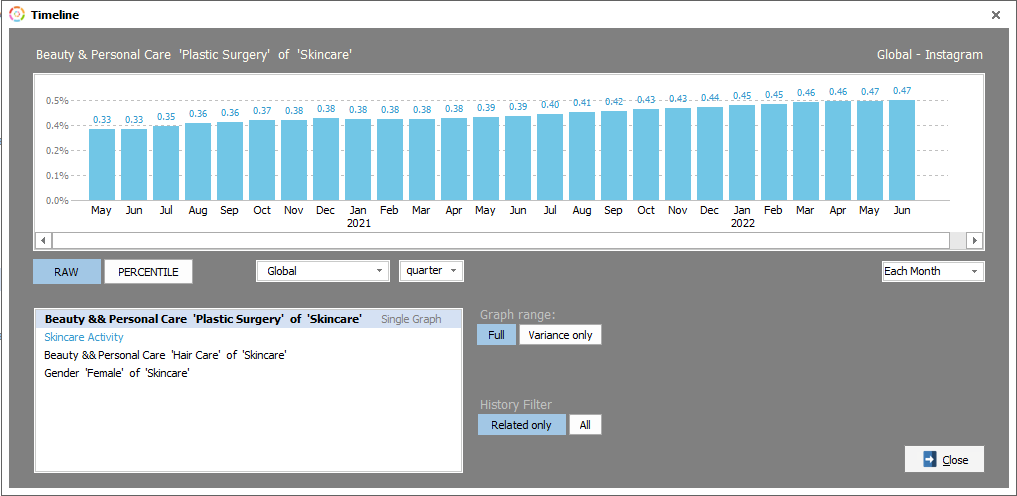
Similar to Demographics, percentiles and medians provide context for raw percentages (image 1). Raw percentages are not particularly meaningful for psychographics, as they tend to be very small. We require a high degree of statistical confidence to identify individuals as interested in a given topic and therefore recommend focusing more on the percentile metrics.
|
|
To enable sorting based on raw percentages, percentiles, or medians, psychographic classifications must be ungrouped. To ungroup them, right-click on the screen and uncheck ‘Group by Category’. Psychographic classifications can also be reduced to top level categories by selecting ‘Show Top Level Only’ and data can be exported to a file by selecting ‘Data to Excel’ (image 2).
|