| | |
| | |
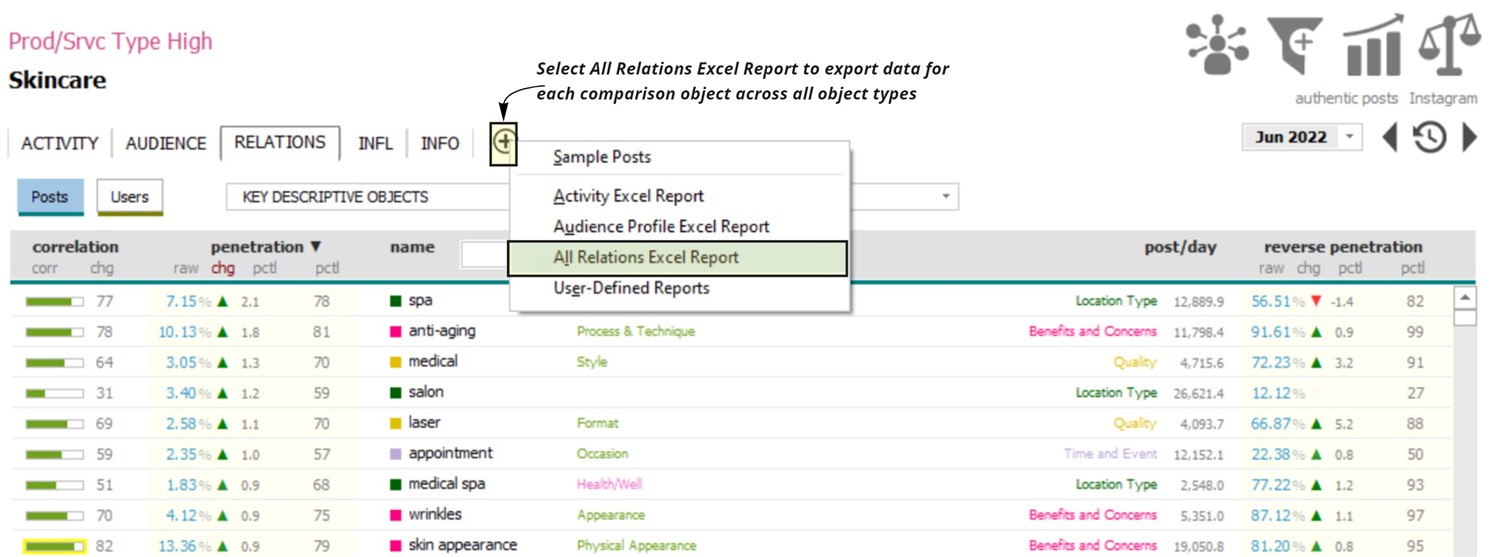
| | | Relations data can be exported similarly to the way data from the Activity Tab can be exported. Select the ‘+’ next to the Info Tab, then select ‘All Relations Excel Report’. Please note this will export all data for each object type - including brands, product/service, ingredients, benefits & concerns, and more. This option will take longer because of the amount of data being processed (image 1).
| |  | | |
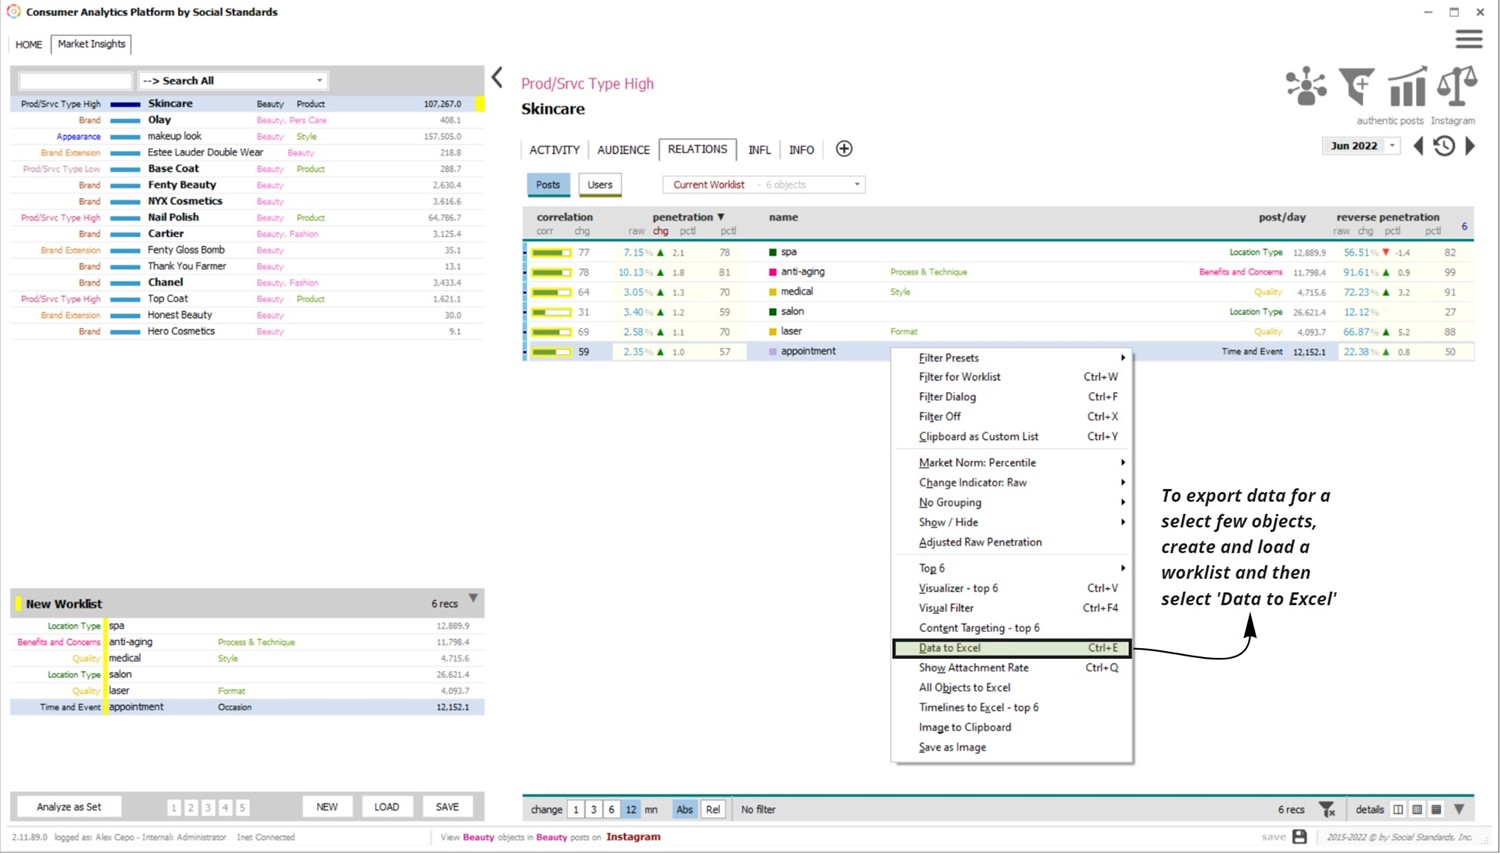
For this reason, it may be more beneficial to curate a list and export a smaller amount of data to Excel (image 2). Create a worklist of all objects whose relational data is of interest. Then, load the current worklist in the Relations Tab. Right-click on the last object in the list and select ‘Data to Excel’.
| |  | | |
To export the data for all objects currently displayed on the screen, right-click on any object in the Relations Tab and select ‘Export to Excel’. Export timelines for all objects above the selected object by right-clicking and selecting ‘Timelines to Excel’ (image 3). If the object is within the top 10 objects, timelines for the top 10 objects will be exported. | | 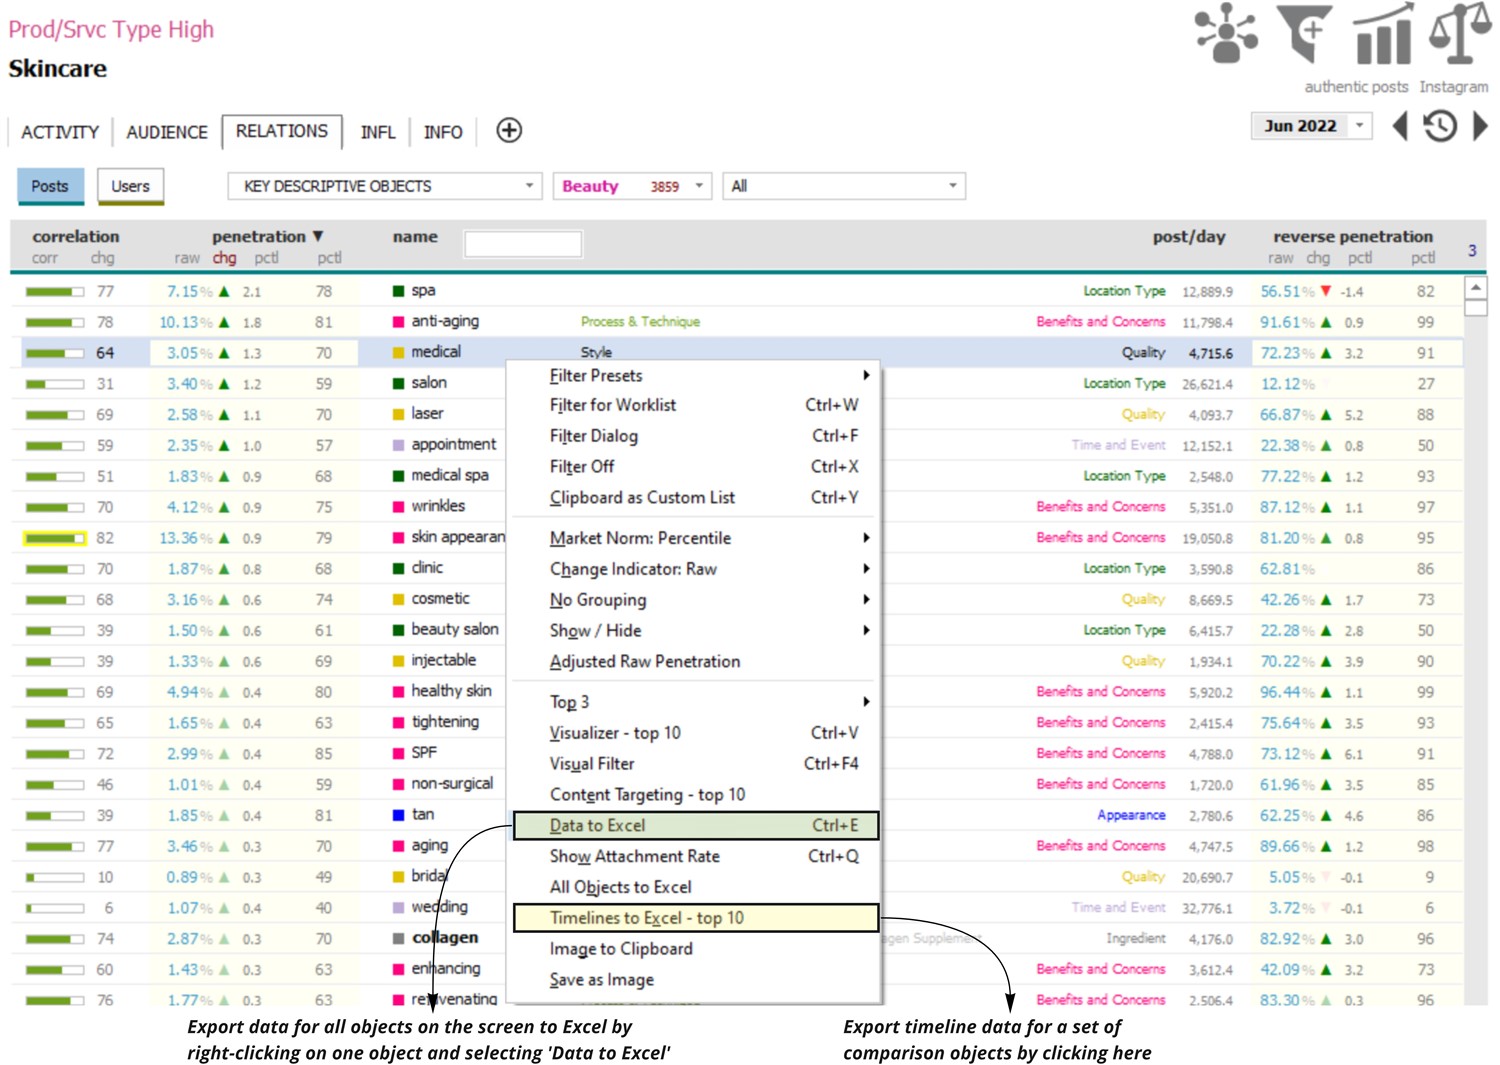 | | | |
