| | |
| | |
| | | The Object Power Filter, or Power Filter, is a function within the application that allows users to curate lists based on conditions leveraging data from more than one market vertical, more than one data source, more than one time period, or a combination of these. It is intended for cross-domain and cross-data-source comparisons and trend identification.
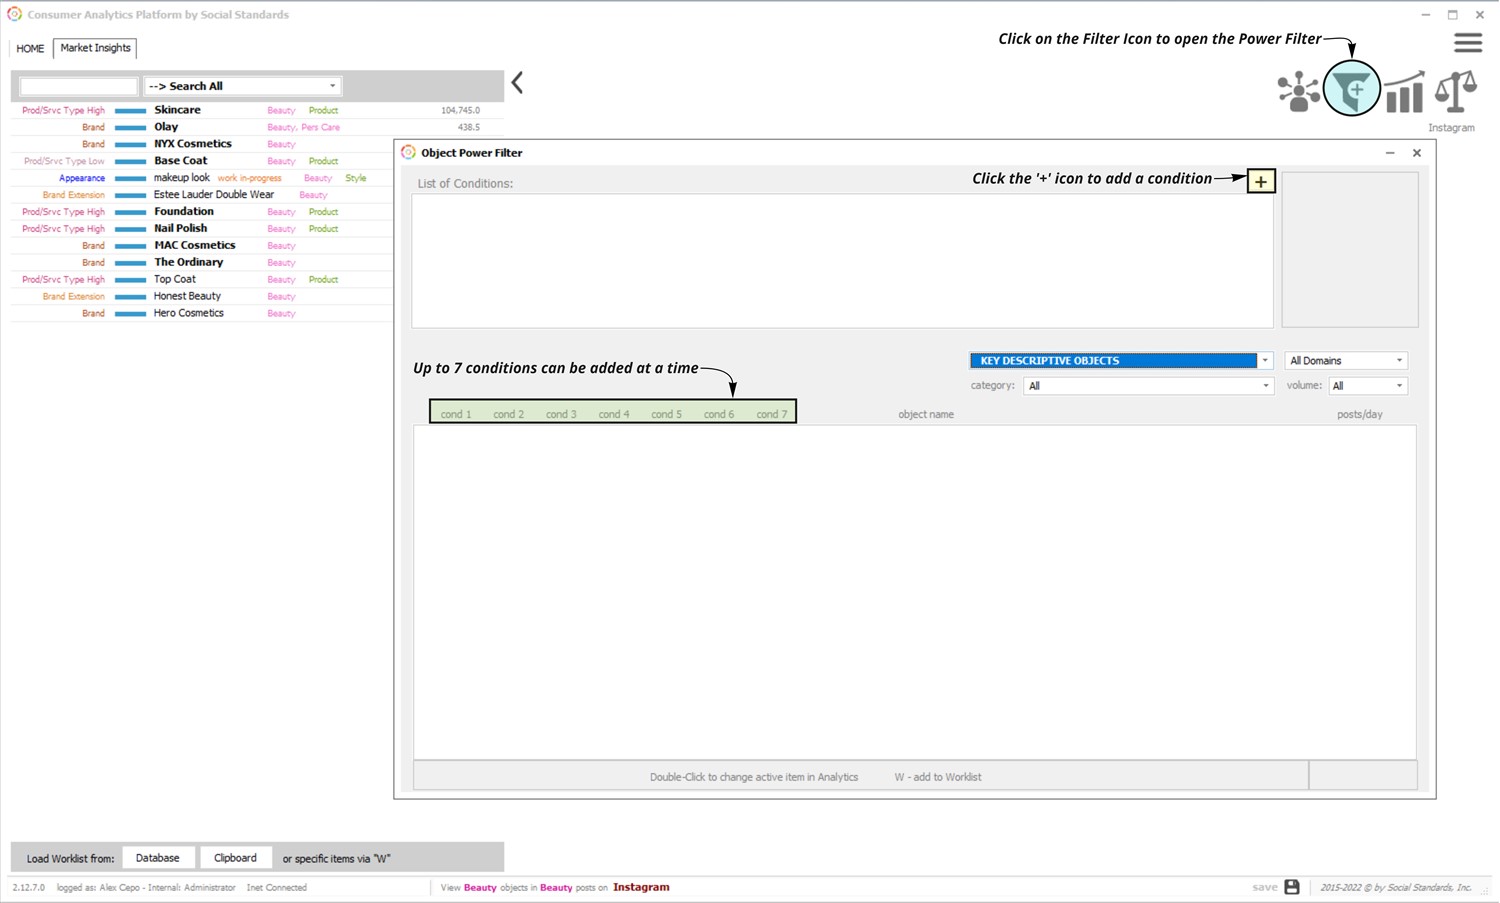
The Power Filter is accessible in the top right hand corner of the Market Insights window. Click on the filter icon (which appears to the right of the Cohort Analysis icon) to generate the Power Filter pop-up (image 1).
| |  | | |
The Power Filter can accommodate up to 7 different conditions for filtering. A metric for each condition will appear in the data table in the column under the numbered condition. (image 2)
| | 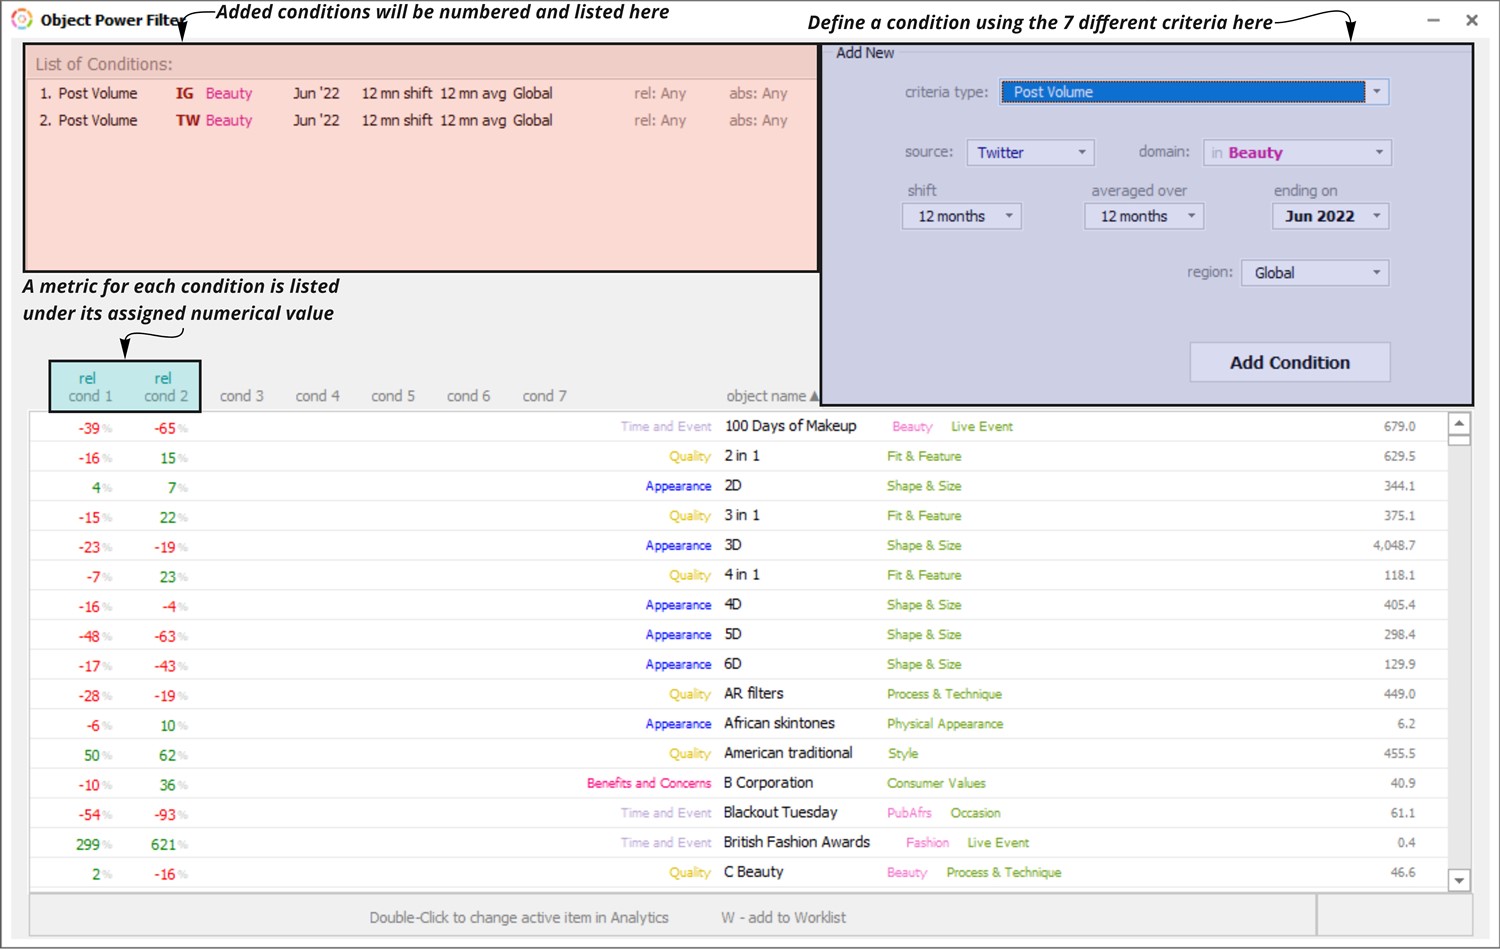 | | |
Each condition can be defined based on 7 different criteria.
Criteria and Conditions
- source: data source
- domain: market vertical or data lens
- shift: time period for comparing change - if the shift is set to 12 months, change calculations will compare YOY. If no shift is selected, the selected metrics will be shown as values (averaged over whatever time period is selected)
- averaged over: averaging factor - if the averaging factor is set to 12 months, the calculation will consider the average of the latest 12 months indicated (a rolling average)
- ending on: last full month considered in the calculation
- region: region for which the data is projected
- metric: measurement of performance
- Post Volume: the # of posts about a topic
- User Retention %: the % users that talked about a topic in one month that continued to talk about it the following month
- New User %: the % users talking about a topic for the first time (in 6 months)
- Domain Percent: the % of a topic's volume in a selected domain (or market vertical)
- Penetration Raw: the frequency at which the topic is mentioned alongside a focus subject (must select a focus subject)
- Penetration Percentile: the significance of the frequency at which the topic is mentioned alongside a focus subject (must select a focus subject) relative to similarly categorized topics, > 60 is over-indexed, < 60 is under-indexed
- Reverse Penetration Raw: the frequency at which the focus subject (must select focus subject) is mentioned alongside a topic
- Reverse Penetration Percentile: the significance of the frequency at which the focus subject (must select focus subject) is mentioned alongside a topic relative to similarly categorized topics, > 60 is over-indexed, < 60 is under-indexed
- Social Relatedness: the topics socially related to the focus subject (must select focus subject), or those with implicit relationships
- User Profile Factor Raw: the % of the topic's conversations coming from selected demographic/geographic
- User Profile Factor Percentile: the significance of the % of the topic's conversations coming from a selected demographic/geographic relative to similarly categorized topics, > 60 is over-indexed, < 60 is under-indexed
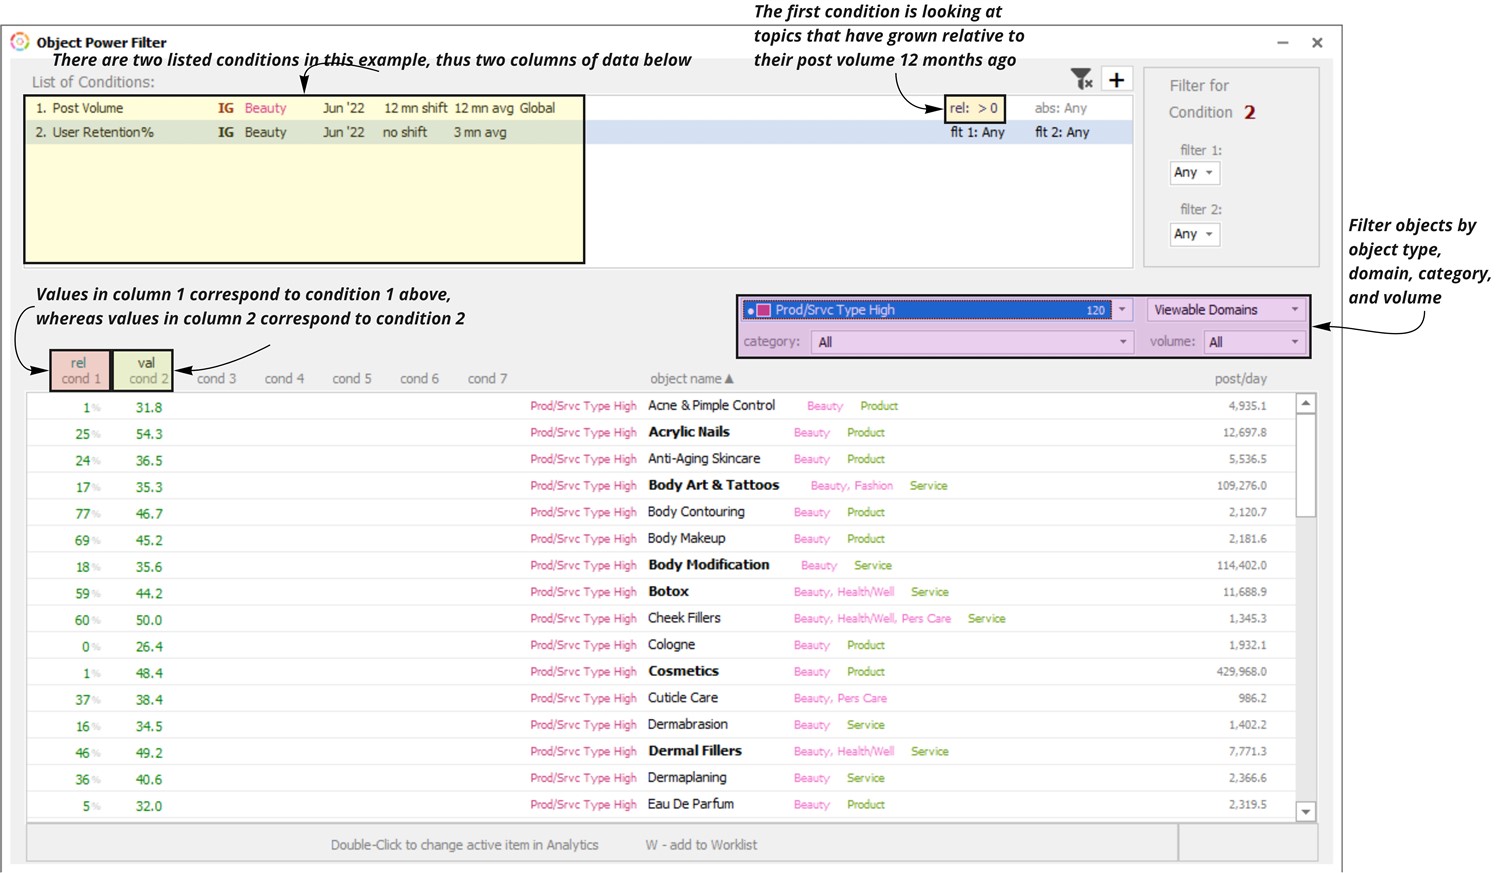
In the example below, there are two conditions being considered such that the resulting list of objects is showing the Beauty products that have the highest User Retention over 3 months (Condition 2) from among those that are growing when comparing May-June 2021 vs. May-June 2022 (Condition 1) (image 3).
| |  | | |
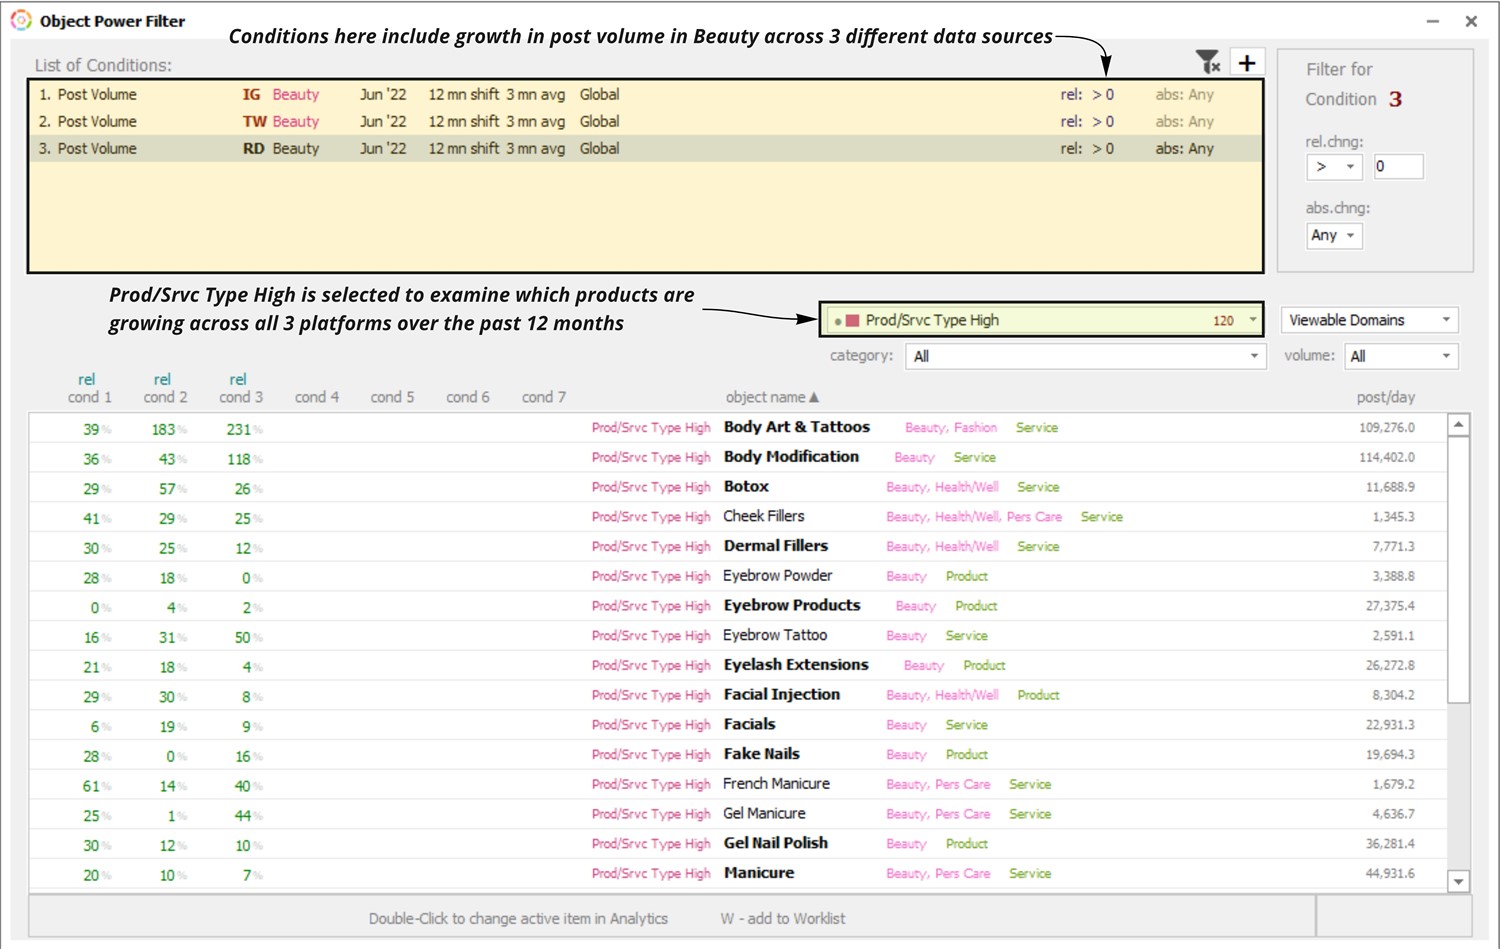
In the example below, there are three conditions being considered such that the resulting list is effectively showing products that are growing in Beauty conversations across Instagram (Condition 1), Twitter (Condition 2), and Reddit (Condition 3). Change is calculated based on comparisons of volume for Apr-Jun 2021 vs. Apr-Jun 2022. By default, objects are ordered alphabetically but can be ordered by any of the three conditions by single-clicking on them (image 4). To switch all conditions from relative change to absolute change, right-click a condition and select ‘All Absolute’.
| |  | | |
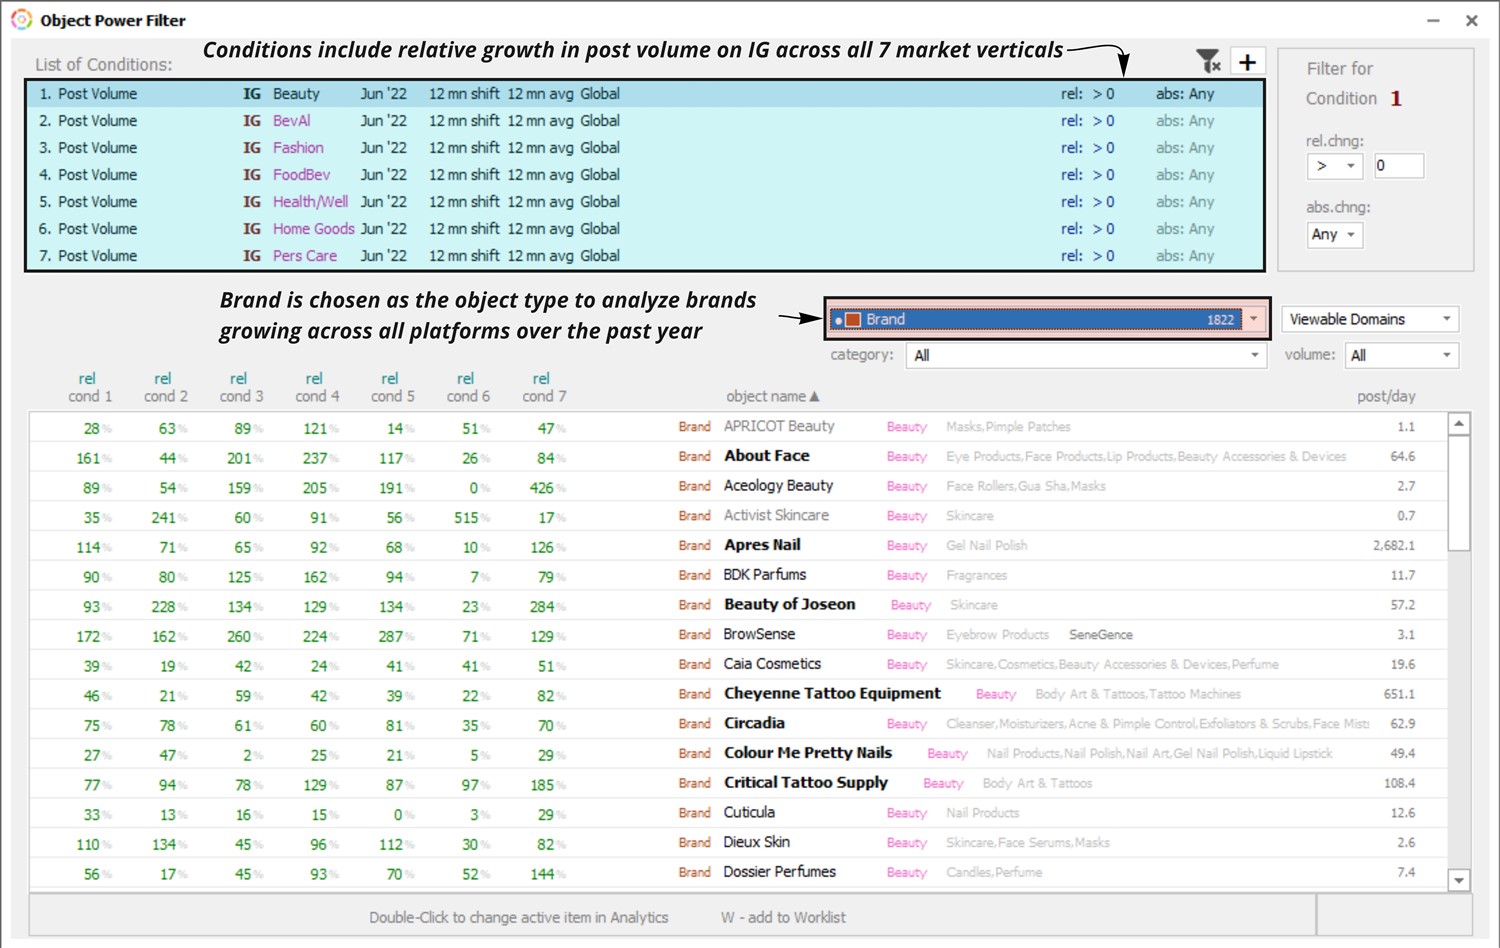
The use case below answers the question “Which brands are growing across all domains on Instagram?” (image 5).
| |  | | |
Other use cases include (but are not limited to):
Confirm Trends Across Multiple Data Sources: Confirm that a list of topics growing based on data from one source are also growing based on data from other sources.
- Example Question: Which Benefits/Concerns are growing in Food & Beverage conversations across Instagram, Twitter and Reddit?
Spot Trend Differences: Spot topics that are performing differently across multiple verticals and/or sources to better understand contextual influences.
- Example Questions: Based on previous analyses, I know that self care is growing consistently in Beauty conversations on Instagram. Is it also growing in Beauty on Twitter and Reddit? Where is it growing fastest?
Calculate 12 month Rolling Averages: Use the "averaged over" drop down to quickly calculated 6 or 12 month rolling averages for select metrics.
- Example Question: From the Activity tab and Trend Analysis screen I've confirmed that (x) is growing over 1 month and 3 month averages. Is it also growing over 6 months and 12 months? Is this topic seasonal?
To export data from the Power Filter, there are several options available in the right-click menu. Right-click on the list of objects and choose between ‘Data to Excel’ or ‘Save as Image’ from the list of options (image 6). | | 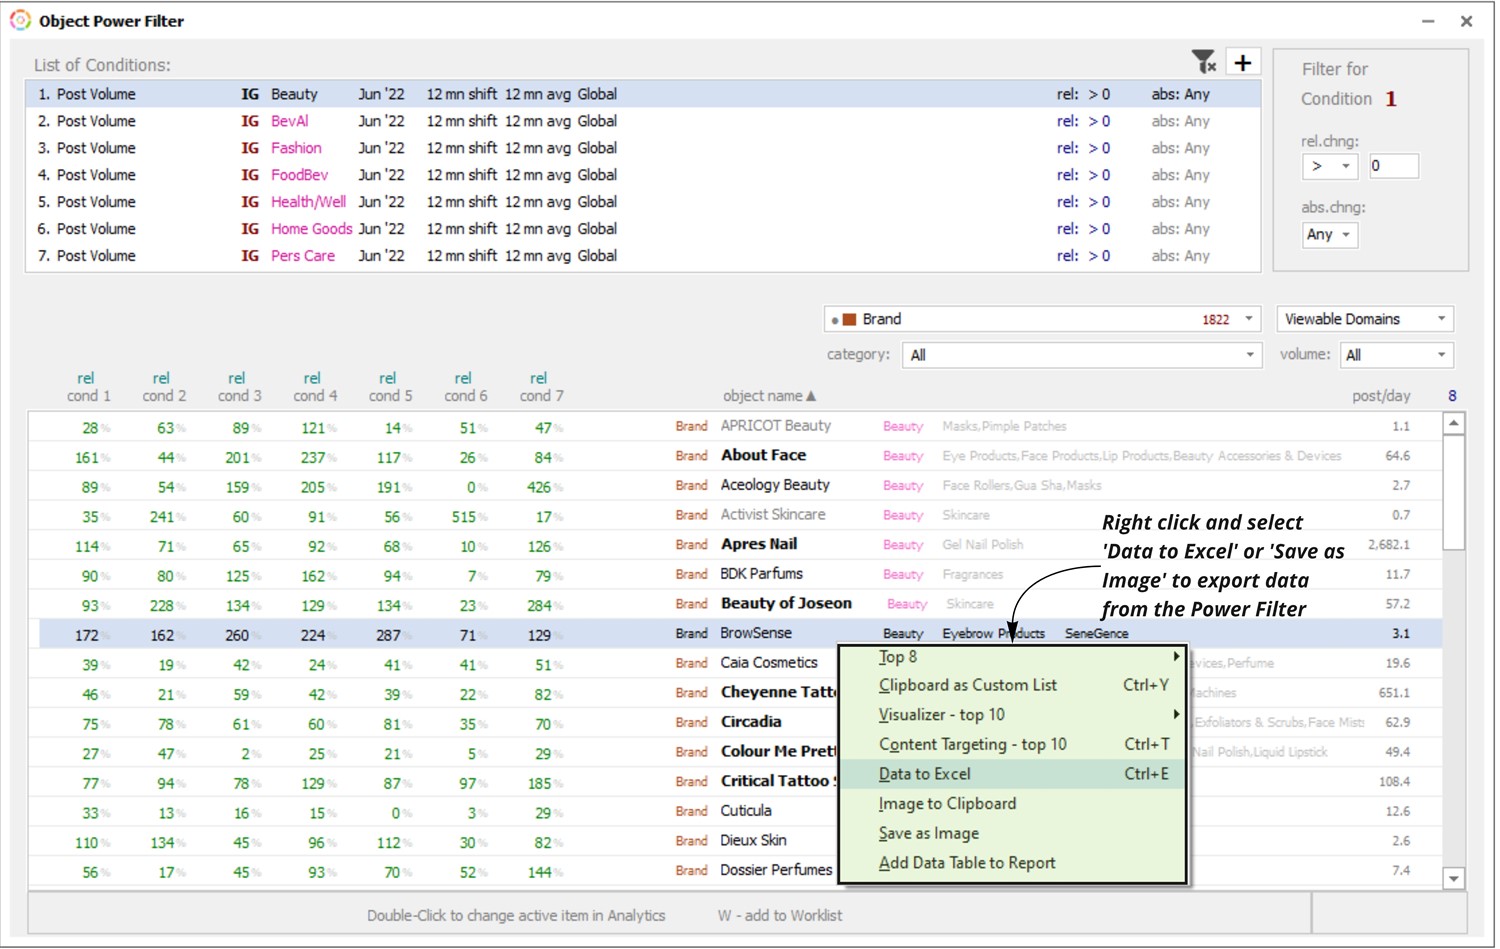 | | | | | |
