|
Conversation volume is displayed as a blue line and is organized by monthly, weekly, and daily time periods. An increase in post volume between two months is indicated by a green bar above the two months, whereas a decrease in post volume between two months is indicated by a red bar. The darker the shading of the bar, the larger the magnitude of change is between those two months. For example, there was a relatively large increase in post volume for Coca-Cola between Nov and Dec of 2020, and a relatively small decrease between Jul and Aug of 2021.
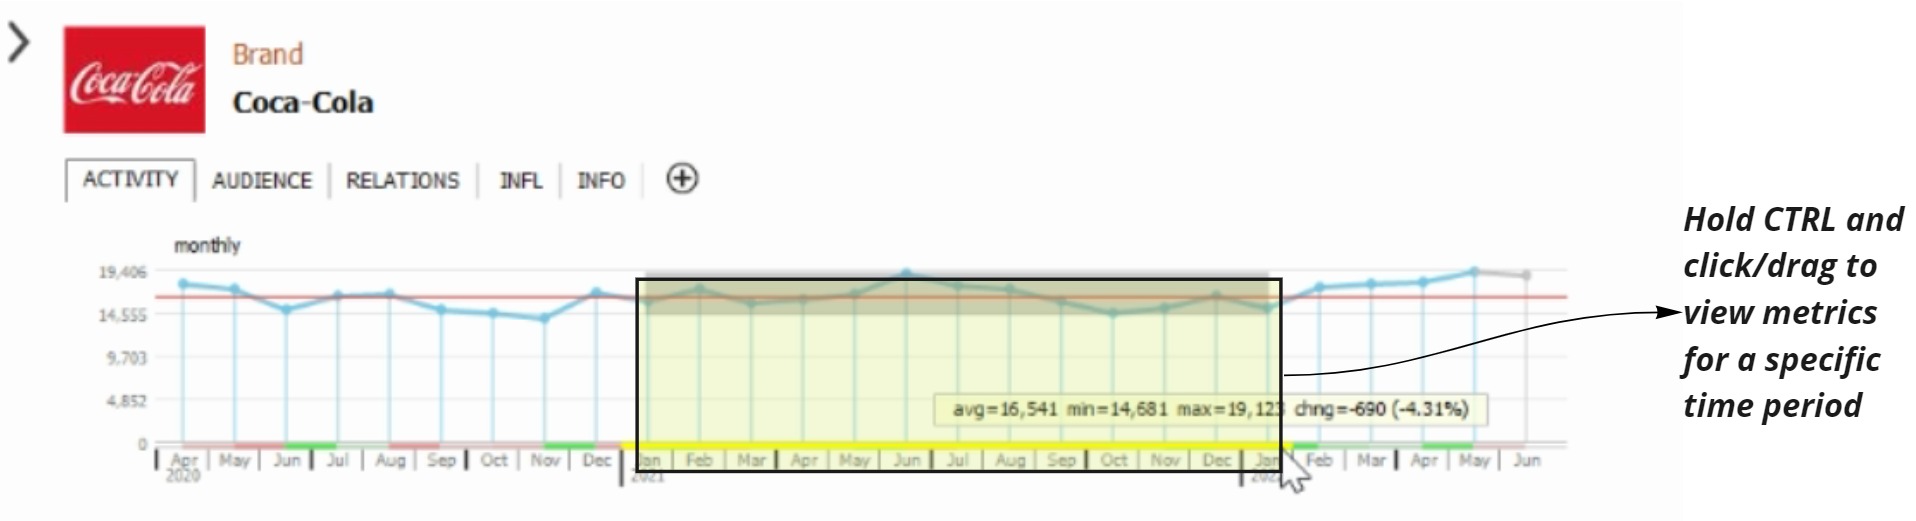
View the statistics for a specific time period by holding down CTRL and clicking/dragging the cursor over the desired time period (image 2). These stats include average, min, max, absolute change, and relative change in # of posts
|
|
Supplemental graphs can be overlaid with the blue activity lines by selecting them from the drop-down menu in the ‘graph options’ box. Graph views can also be adjusted in this box. The default view for each graph is Full and Condensed.
Choosing Variance instead of Full affects the y-axis ranges of all of the graphs in the Activity tab (image 4). While Full sets the y-axis minimum to zero, Variance sets the y-axis minimum to the minimum value of the graph. In both cases, the y-axis maximum is the maximum value of the graph.
|